

Measurements at Children’s Home
by Carla Wunsch, TED
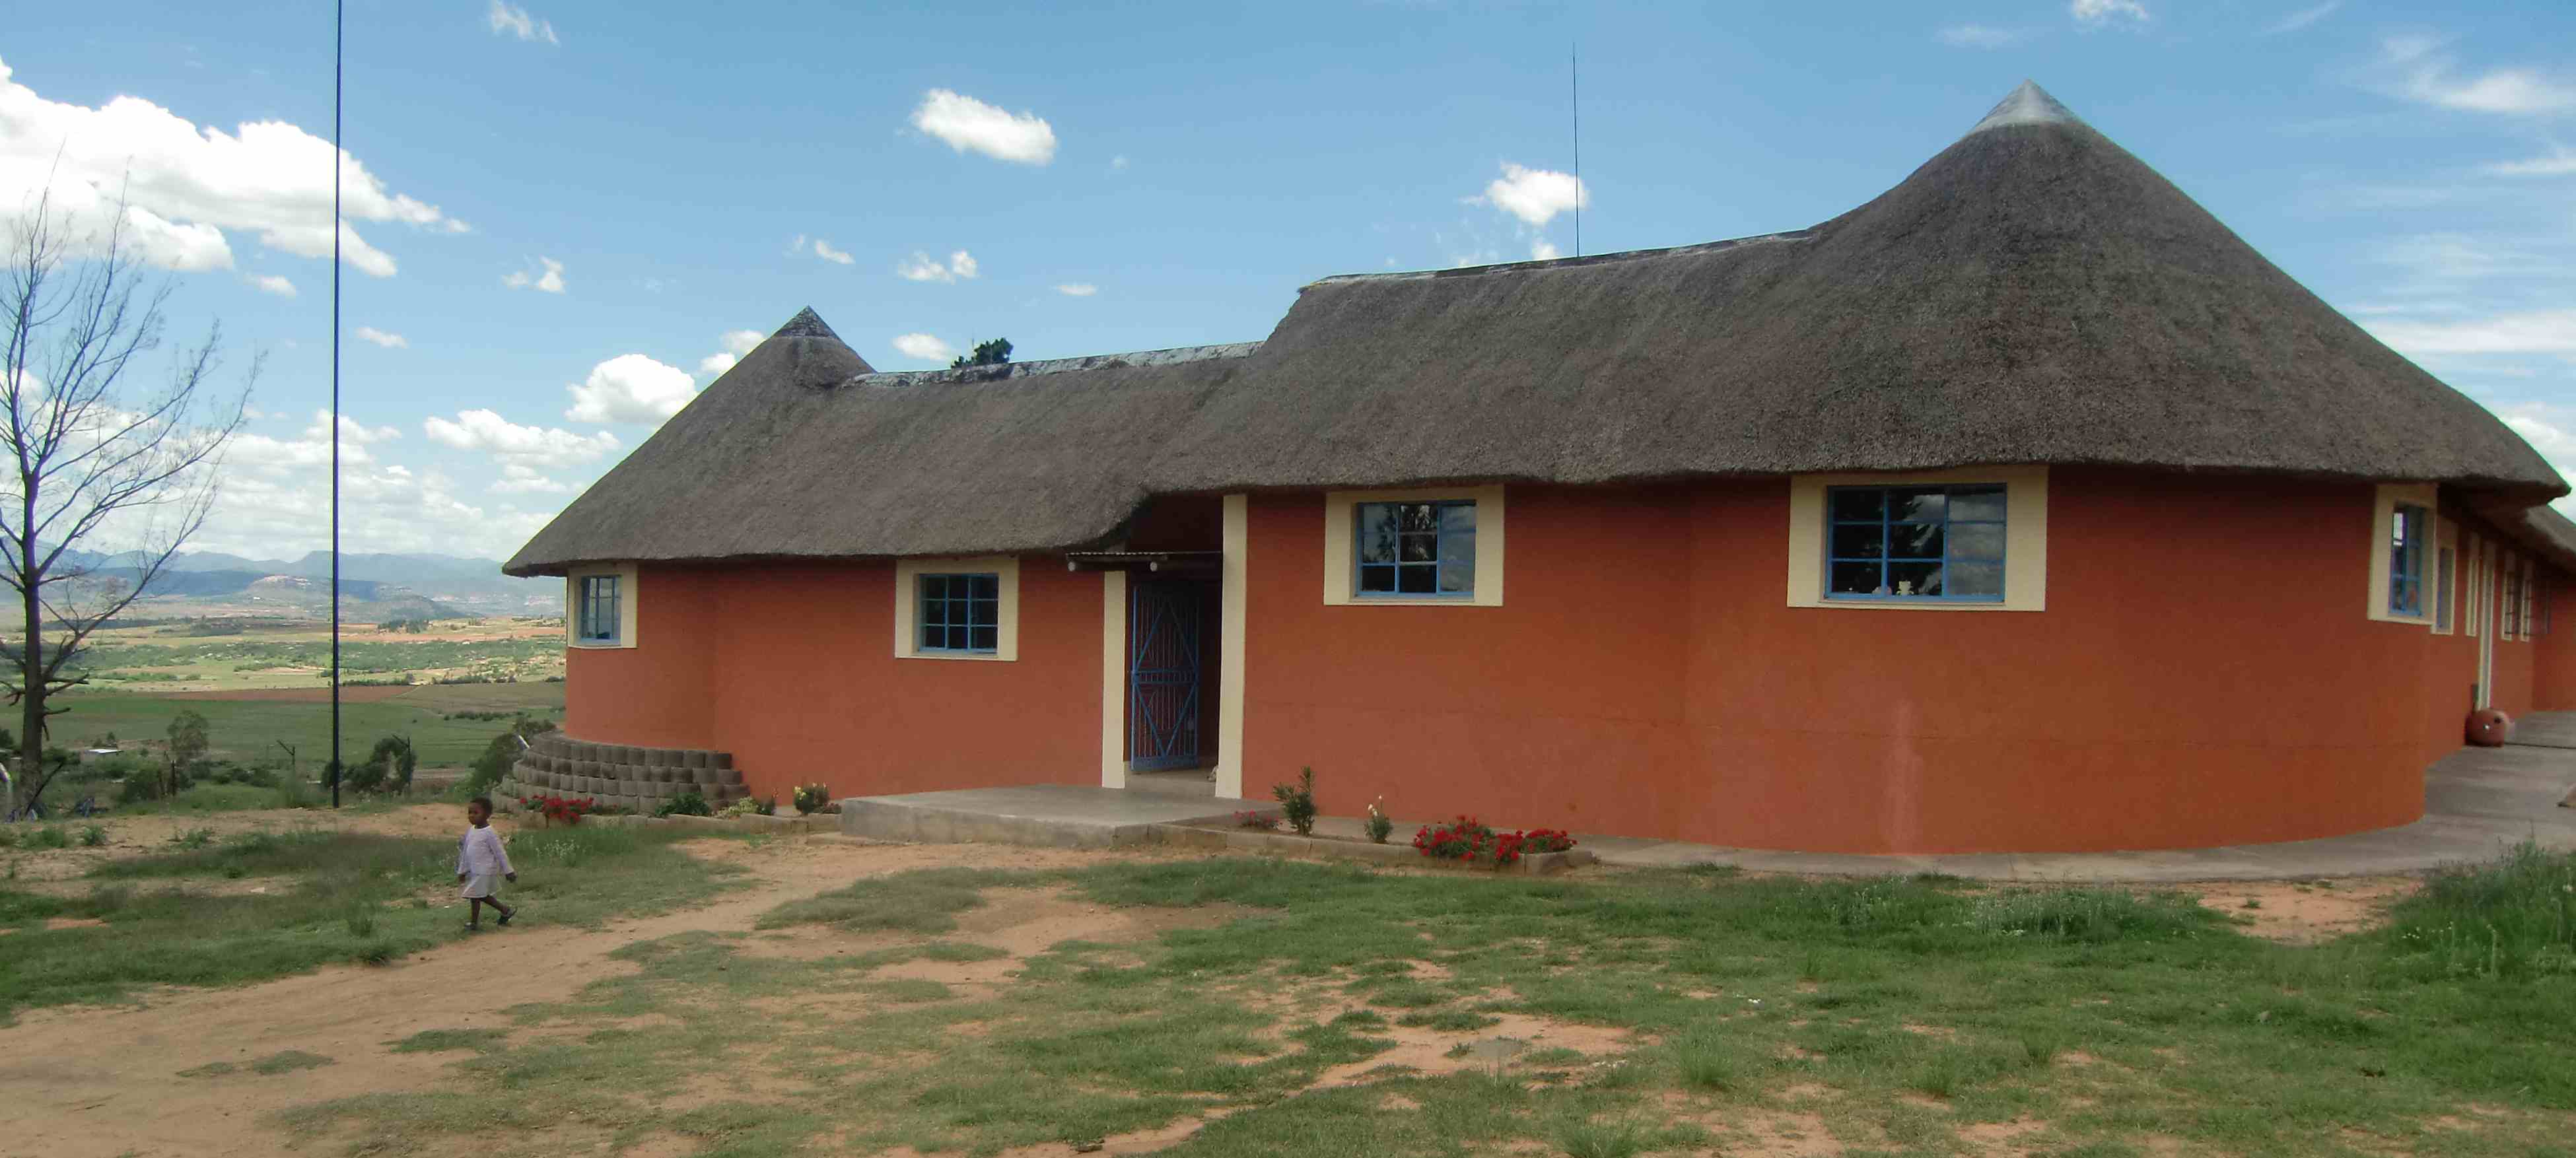
Figure 1: Children’s Home Maseru
TED- Technologies for Economic Development, a Non-Governmental Organisation (NGO) based in Lesotho, is constructing biogas systems since 2004, and since 2006 in combination with more components as DEWATS (Decentralised Wastewater Treatment System) plants. Biogas/DEWATS is implemented mostly in developing countries having a tropical or subtropical climate. There are only few information about Biogas/DEWATS performance in winter cold regions with temperatures below 0°C at night during several months, as it is the case in Lesotho. Biogas/DEWATS technology and processes depend on microorganisms, which are especially sensitive to temperature changes. To obtain more insights into the development of treatment processes during the winter months, TED started a measurement campaign in September 2010, at the end of winter, involving the two installations at Children’s Home and St. Angela Chesire Home. Parameter like COD and temperatures were measured. In June 2011 – in mid-winter, further samples have been taken at the Children’s Home Biogas/DEWATS plant. The analysis reveals that the system works completely different. Several facts impact the analysis of the data: in 2010 there were more residents with obviously less water consumption and as a result a higher organic load in the influent wastewater; samples have been taken in different moments in wintertime at varying ambient temperatures, but the temperatures in the system itself differ only about 3°C. It can be concluded that the system continues to work even under changing conditions.
1. What is a Biogas/DEWATS plant?
Kitchen waste, animal manure and human excreta for the most part consist of organic material, mostly long-chain molecules classified as polysaccharides, proteins and fats. Their degradation happens either in aerobic or anaerobic processes. Biogas/DEWATS plants mainly operate with anaerobic degradation, which develops in 4 steps - hydrolysis, acidogenesis, acetogenesis and methanogenesis – each step with the support of different bacteria under different conditions like pH, temperature and impurities. In the hydrolysis the oxygen stored in the organic material is used for transformation, and after having consumed these remainders, the real anaerobic phase starts. One product of anaerobic degradation is called biogas, composed of mainly two components: carbon dioxide CO2 and methane CH4. Anaerobic degradation takes place in the Biogas Digester and/or the Anaerobic Baffled Reactor, which could be chosen as first treatment steps of a Biogas/DEWATS plant. Depending on environmental conditions and site demands the Biogas Digester, Anaerobic Baffled Reactor, Anaerobic Filter and Horizontal Filter could be combined to work in a perfect adapted way and meet the demands.
2. The Biogas/DEWATS system at Children’s Home
The TED Biogas DigesterThe TED Biogas Digester is a dome shaped reactor, made of brickwork and integrated into the ground. It has an inlet and an outlet. At Children’s Home the 9m3 underground structure receives the sewage pipes coming from the 4 toilet blocks, 3 bathrooms and the kitchen sink as well as the laundry. In the dome, which is completely airtight, microorganisms degrade the organic material into biogas thus reducing significantly the organic load in the then pre-treated sewage. The biogas is stored above the wastewater level in the dome shape. It is used in a kitchen stove to prepare lunch for the residents. The outlet is connected to the next treatment step, an Anaerobic Baffled Reactor.
Anaerobic Baffled Reactor (ABR)
The ABR includes a series of chambers in which the pre-treated wastewater is forced to flow upstream from chamber to chamber. During this movement solids still contained in the wastewater settle down to the bottom in each chamber forming a layer of activated sludge where anaerobic bacteria and microorganisms continue to degrade remaining organic matter. The wastewater is forced to pass through the sludge layer. The bacteria use the pollutants in the water for their metabolism. So the wastewater is further treated while flowing from chamber to chamber. The size of the chambers depends on the sewage flow rate, because the up flow velocity of the water should be less than the settle velocity of the solids; otherwise the solids could be flushed out into a filter; this should be avoided.
At Children’s Home the ABR totals 10m3. Seven chambers are working as Baffled Reactor; the structure however includes also three chambers for the following treatment step, the Anaerobic Filter Reactor. Manholes on each chamber facilitate maintenance work.
Anaerobic Filter Reactor
The Anaerobic Filter Reactor provides a third treatment step: pre-treated water passes through a gravel filter. On the gravel surface a layer of active bacteria grows and converts remaining organic particles. Like in the Baffled Reactor the water passes the filter vertically from the bottom to the top. As mentioned above, in the case of Children’s Home, the Anaerobic Filter is integrated into the ABR structure, occupying three chambers filled with gravel as filter material.
Horizontal Planted Gravel Filter
The Horizontal Filter, at Children’s Home a 30m2 Planted Gravel Filter, is an open basin filled with gravel and planted with aquatic plants. It functions as post treatment for wastewater to make it finally fit for re-use in irrigation. At this stage of the treatment, the water should have a low solid concentration in order to avoid blockages in the filter. Biological conversion, physical filtration and chemical adsorption are the three processes taking place in this last DEWATS component.
The water flows horizontally and slowly through the filter material. It is treated aerobically, the remaining solid particles are filtered and converted, and the concentration of phosphate in the treated water is reduced up to 80% through adsorption by the aquatic plants, giving the Planted Gravel Filter a nice appearance. They also use their roots to transport oxygen into the water.
3. Parameter to evaluate the performance of the system
COD and BOD: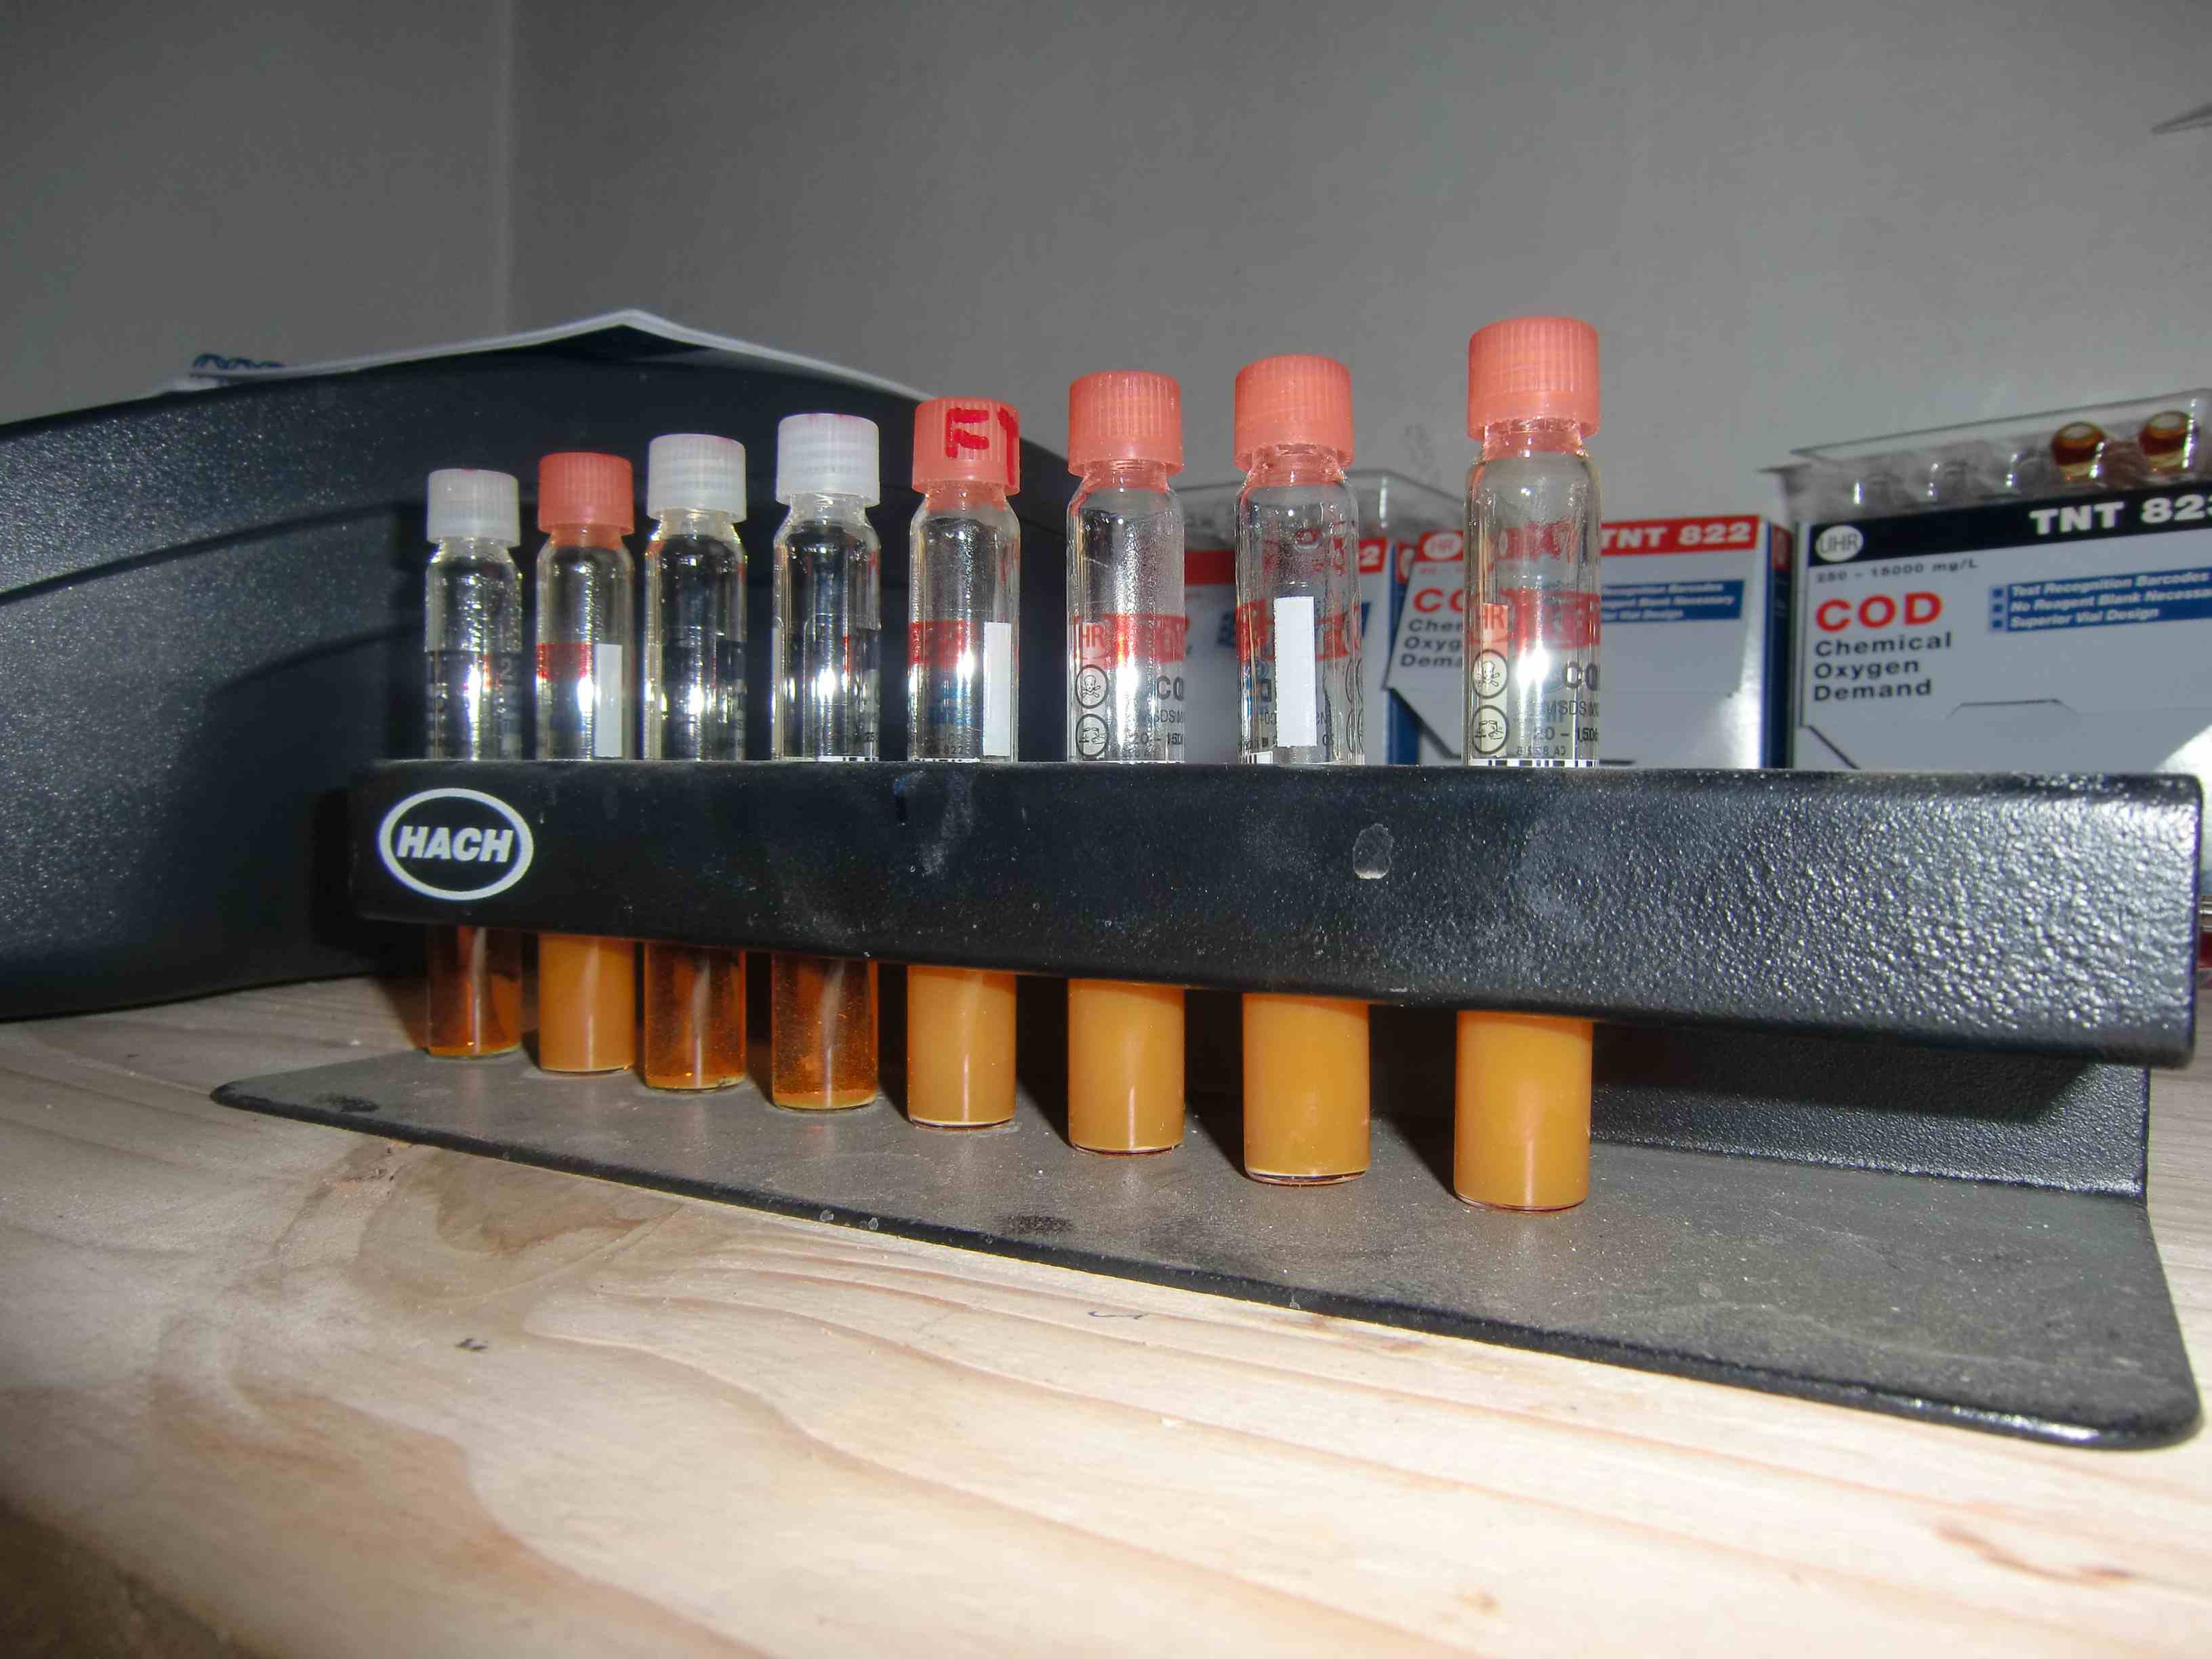
Figure 2: COD test vials
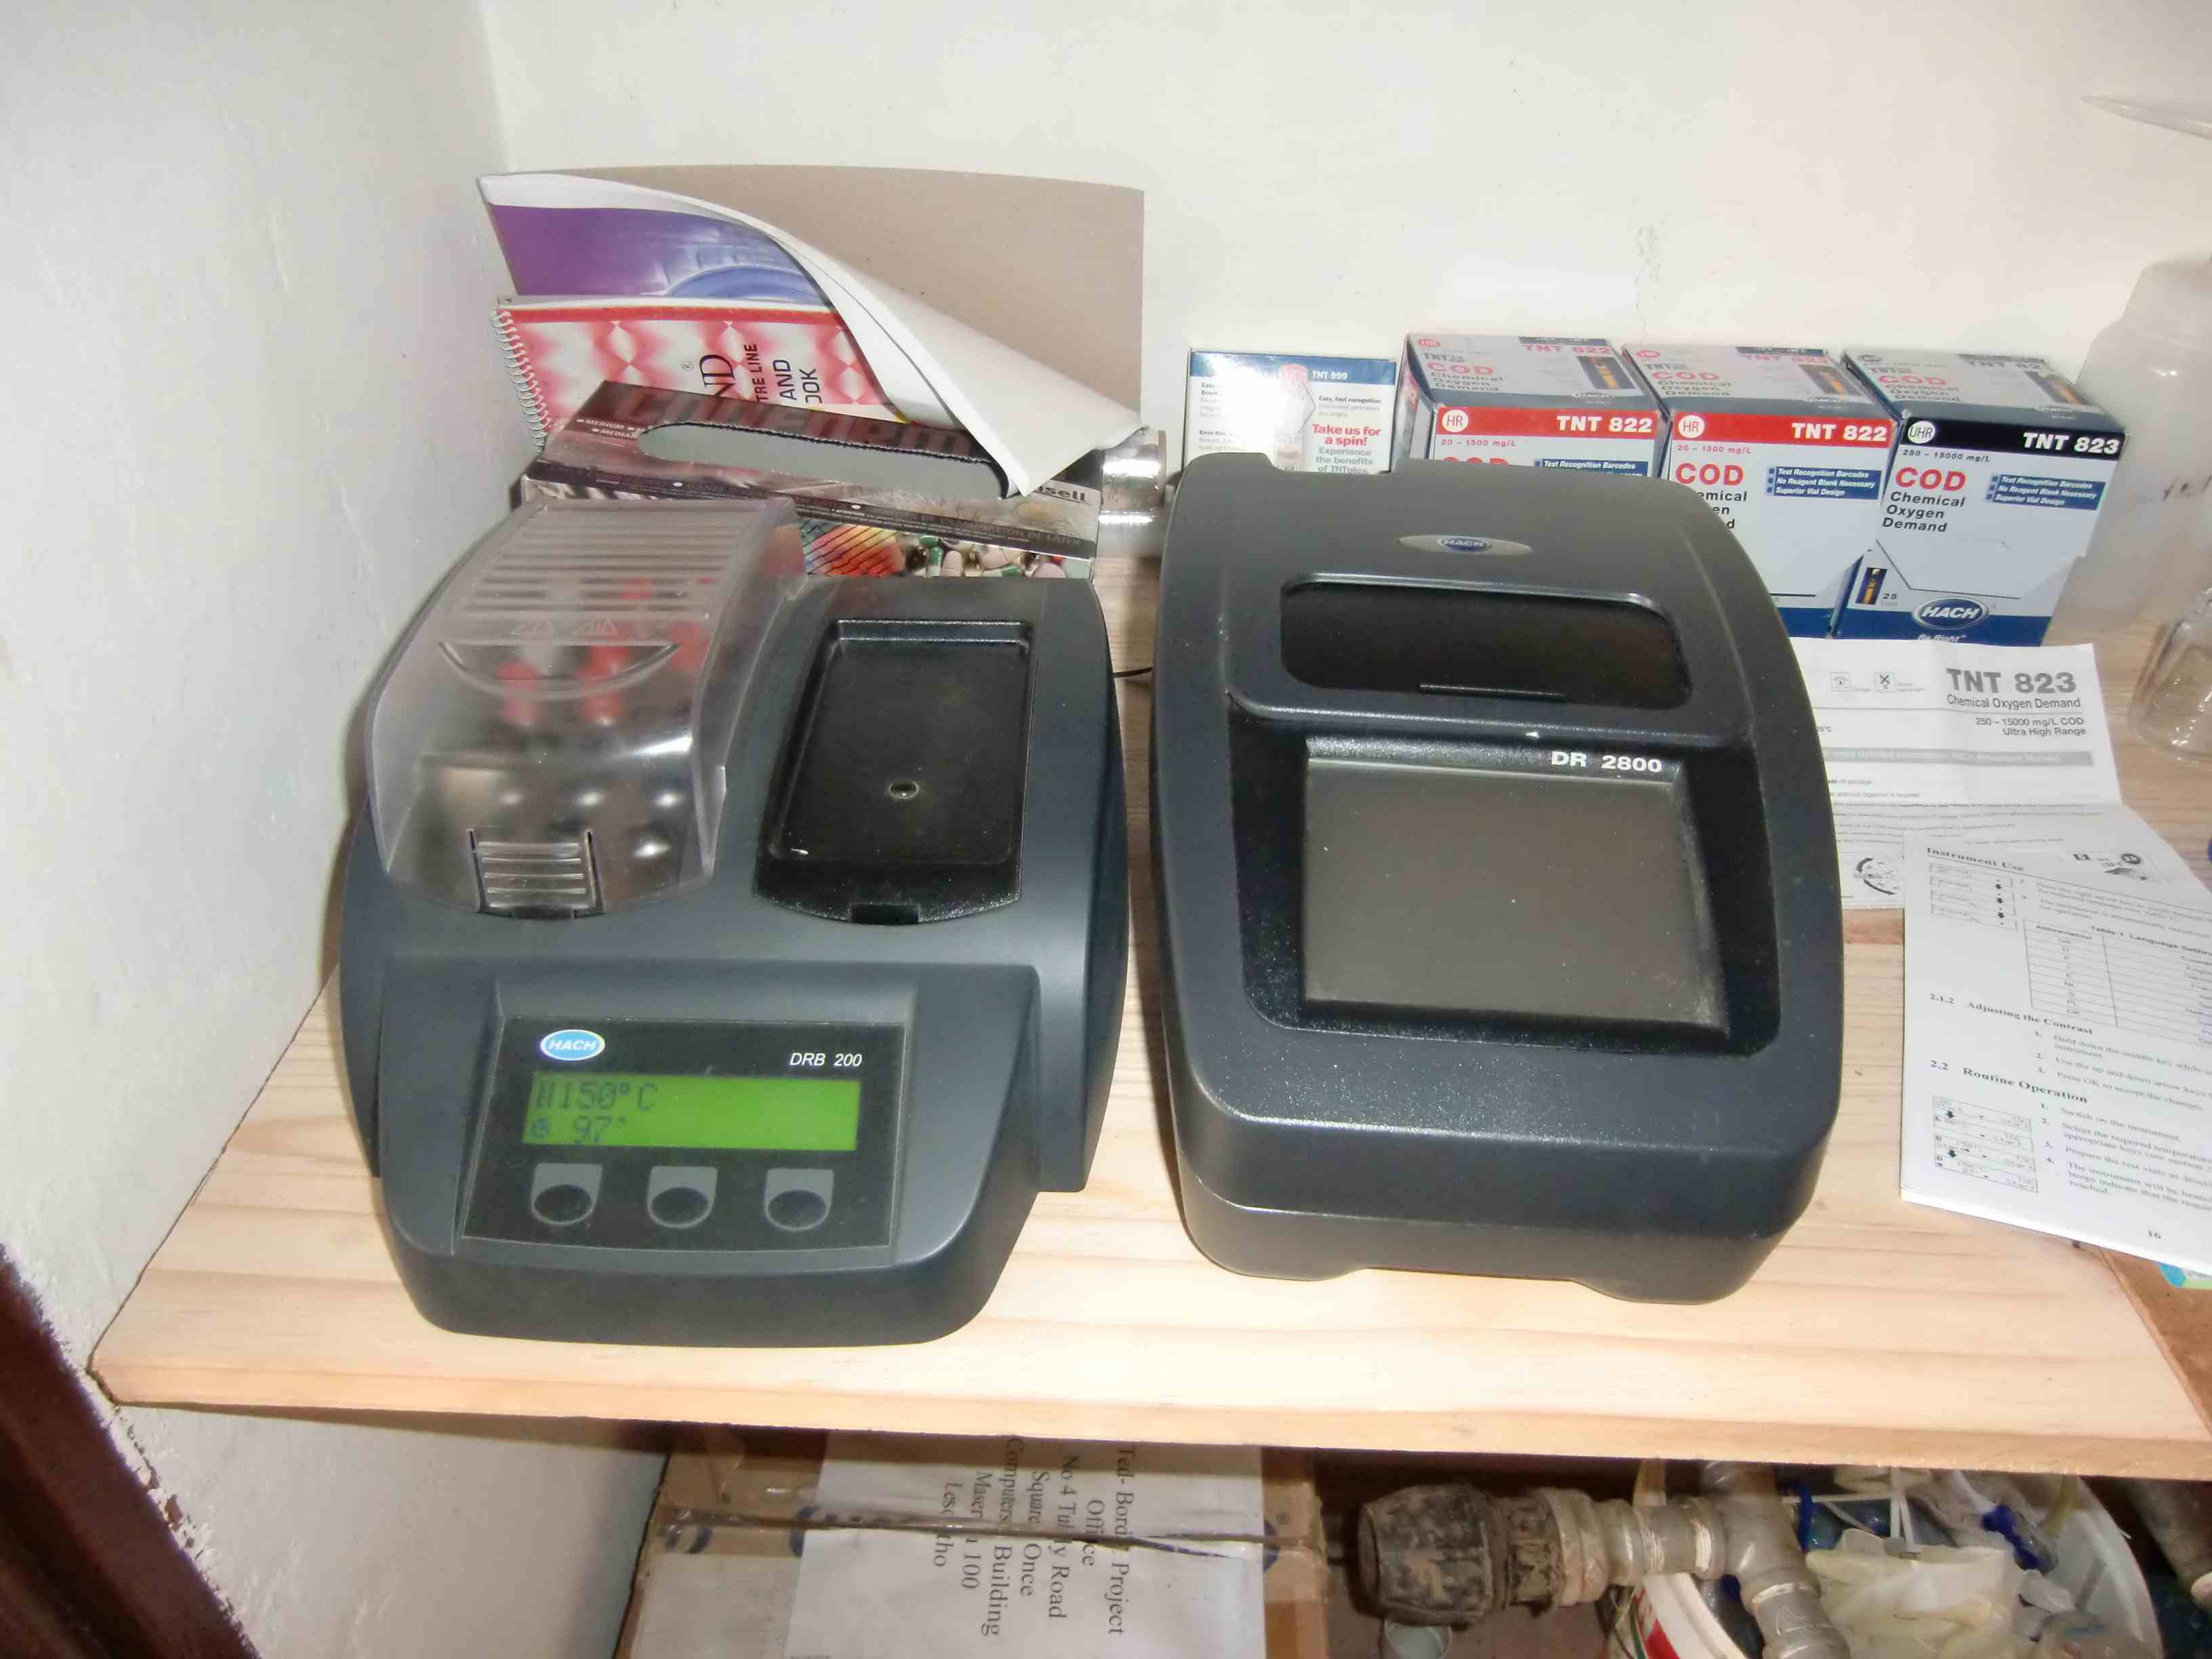
Figure 3: HACH Laboratory equipment for COD test
The COD should decrease with every treatment step. The rate of decrease provides information about the efficiency of the step, therefore measurements are required at the digester outlet, the last chambers of ABR and Anaerobic filter and the PGF overflow point. To obtain the BOD of each treatment step it is required to know the not biodegradable COD. BOD is the difference between the total COD and the not biodegradable COD. To measure the not biodegradable COD, a wastewater sample is analysed during several months until the COD value remains unchanged from one month to the other.
Methodology:
At the relevant points of the system samples of wastewater are taken in a representative quantity of at least one litre per sample. The samples have to be stored in a cooling box, and as soon as possible brought to the laboratory for analysis. The time between sample taking and analysis shouldn’t be over 4 hours. In the laboratory the sample has to be thoroughly mixed. With a COD vial test (TED is using HACH) the filtered or total COD can be measured. The vials contain the strong oxidant potassium dichromate. A defined quantity of treated wastewater, which has to be analysed, is filled into the vial, which is then heated for 2 hours at 150°C. The oxidant eliminates completely the oxidable load in the water. After 2 hours the COD is analysed by means of a photometer.
Wastewater quantity:
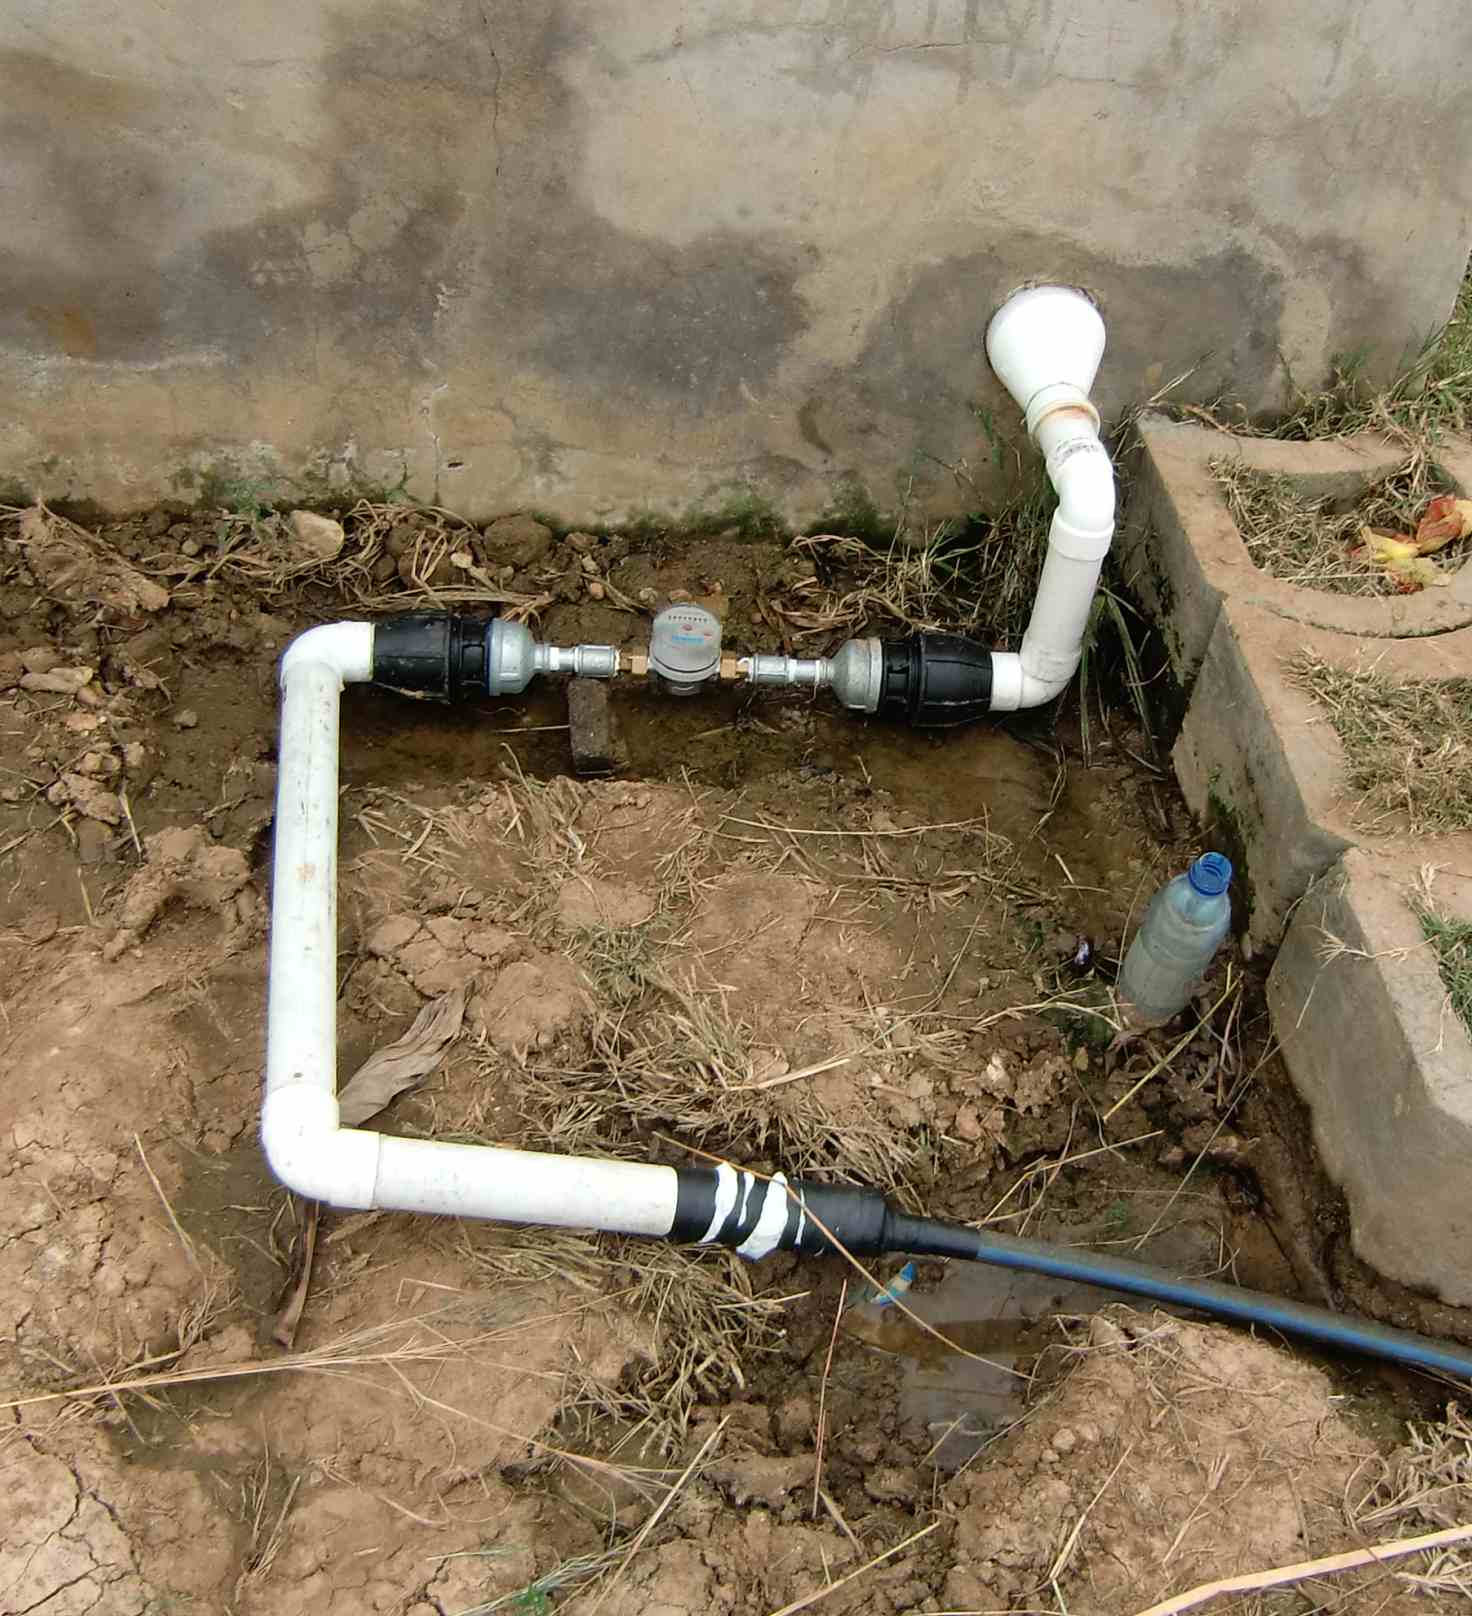
Figure 4: Water meter at PGF effluent
Methodology:
At the final effluent point of the system, in the PGF, a water meter was installed and during 2 weeks the wastewater production (flow rate) has been recorded once a day. As the PGF is 30m2 during rain seasons it absorbs a lot of rain water. This amount of water is also measured but it doesn’t reflect the wastewater amount. The evaporation process in the PGF also can affect the result especially when the waste water flows slowly trough the system.
Operational temperature of Biogas/DEWATS:
The temperature affects essentially the activity of the microorganisms. Biogas/DEWATS plants could operate within three temperature ranges: psychrophilic (<20°C), mesophilic (optimum: 30-42°C) and thermophilic (optimum: 48-55°C). In each category different microbial strains grow and work, but they are only adapted to this specific temperature range. They react sensitive to all temperature changes with the risk of resulting in a complete stop of biogas production, which is at the same time an indicator for treatment activities. Even small variations of the system temperature can kill the microorganisms. Usually biogas production is reduced when temperatures drop; therefore during in wintertime less biogas – and therefore reduced treatment efficiency - should be expected. A higher retention time of the wastewater is then needed to degrade the organic load or it might lead to a limited treatment efficiency of the Biogas/DEWATS in winter.
Methodology:
The temperature of the tab water, the digester in- and outlet, the 1st, 3rd and last chamber of the ABR, the last chamber of the AF and the PGF effluent was measured.
Ambient temperature:
The ambient temperature and also the current weather impact the interpretation of results. Low temperatures in the system could be caused by the cold weather.
This data can be tracked from the Internet where the Maseru Meteorological Office updates weather data every 5 minutes:
www.wunderground.com and
www.worldweatheronline.com
pH value:
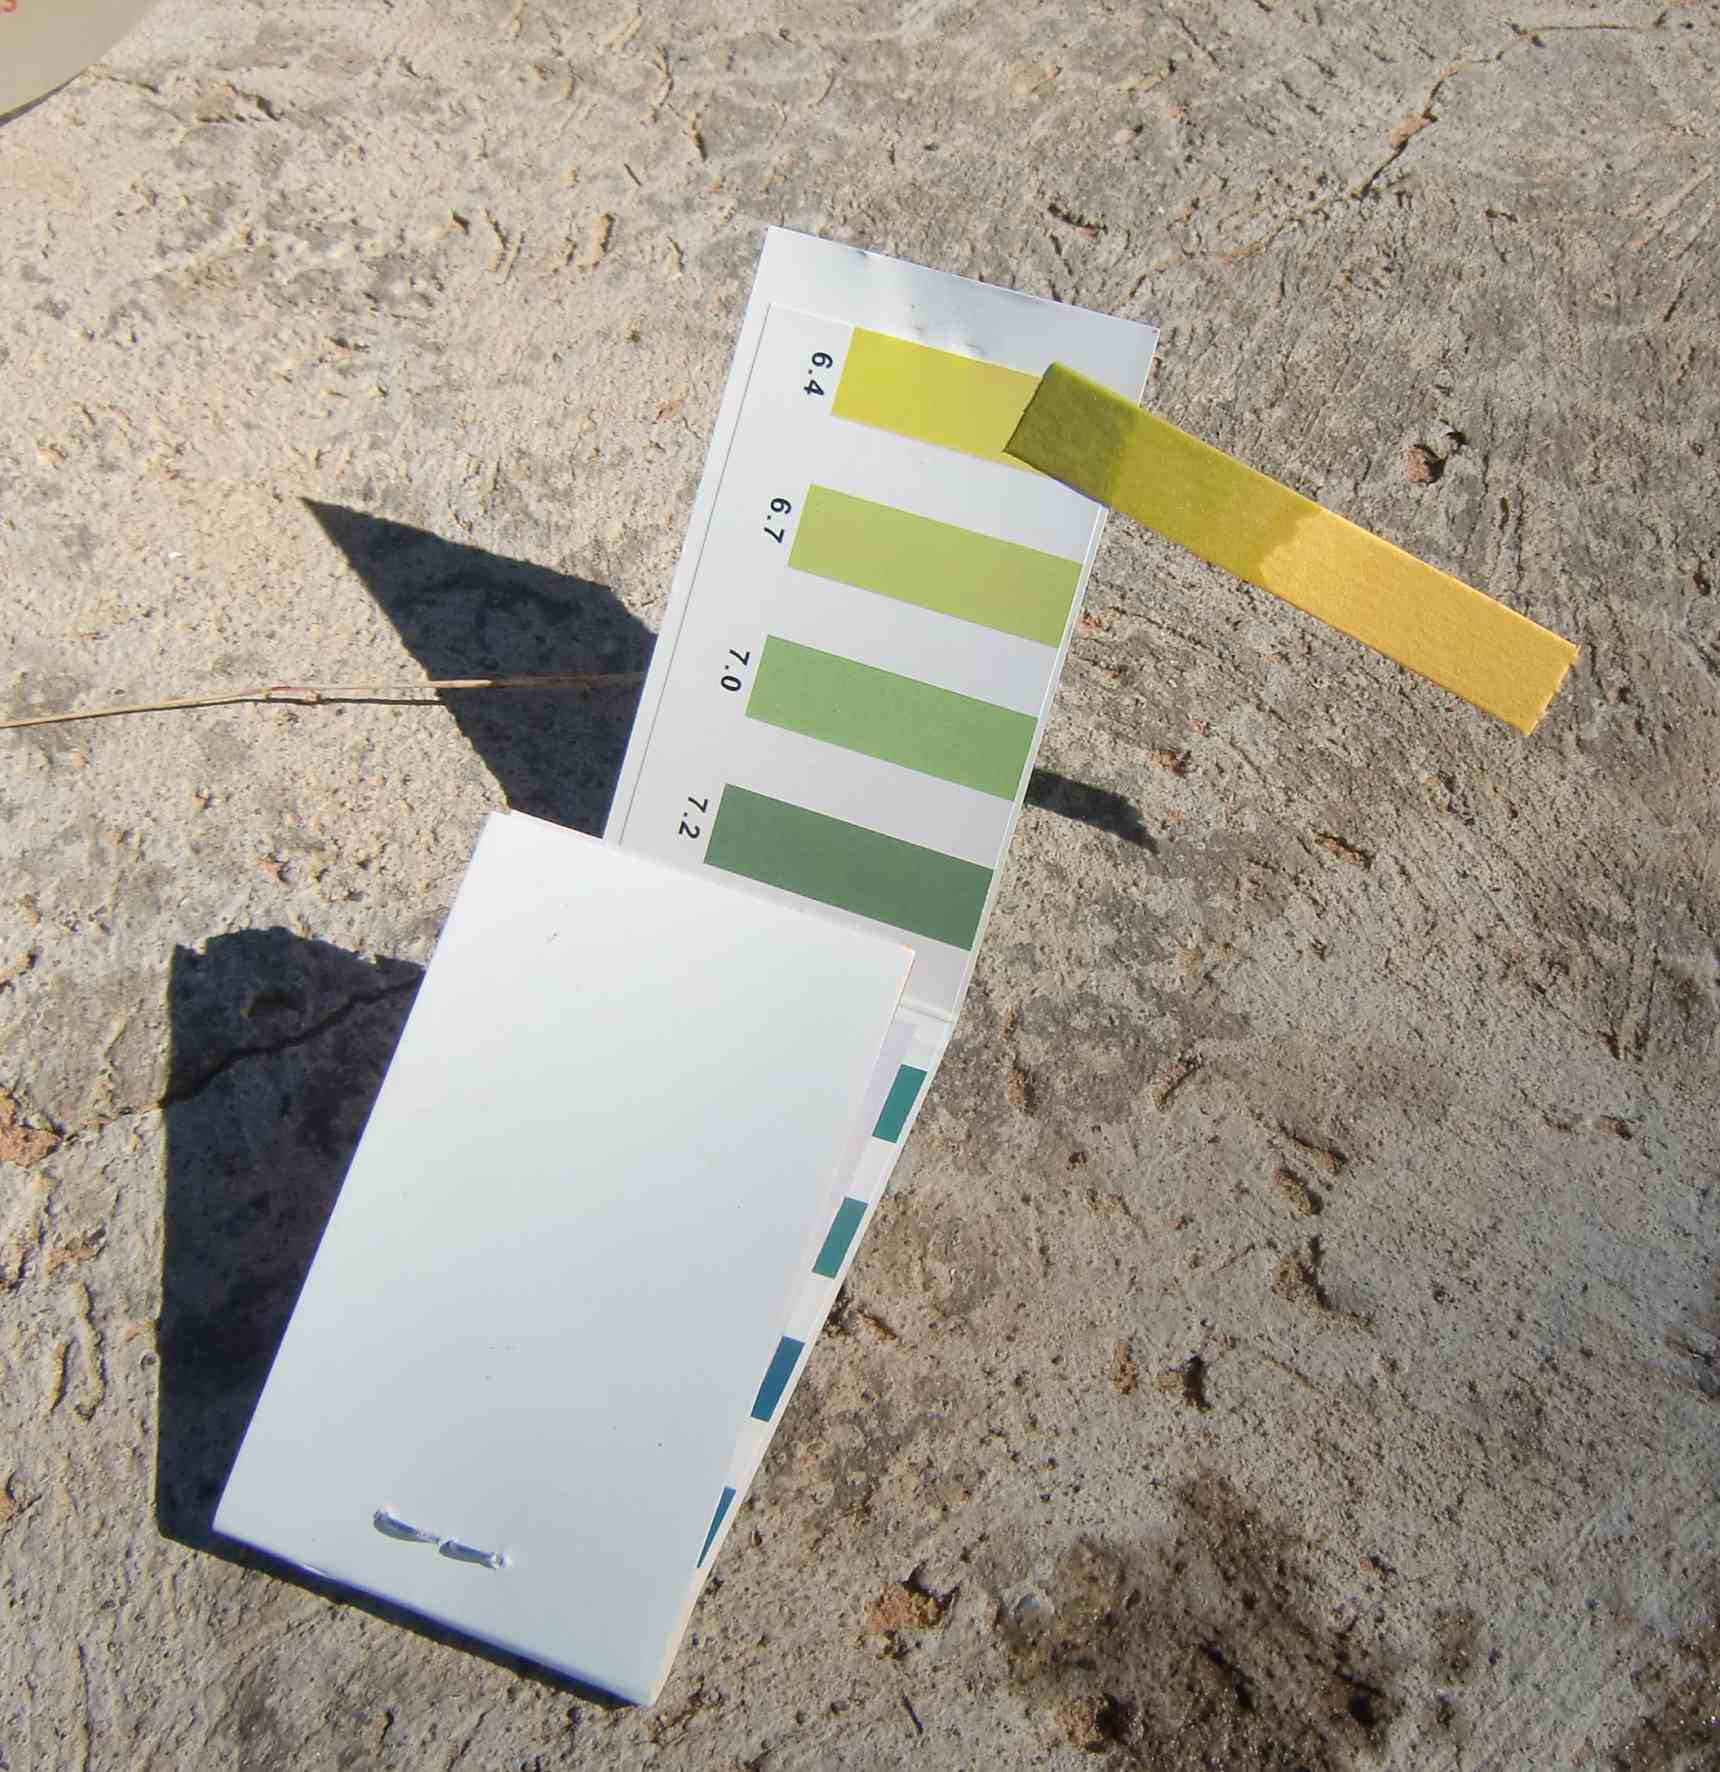
Figure 5: pH measuring tape
Settle able solids:
Settle able solids existing in wastewater are organic or inorganic solid particles of varying sizes, densities and shapes that are able to swim and sink in a fluid. Different particles have different settling velocities. If the retention time in the digester or the ABR is too short or if the flow velocity is faster than the settling velocity particles remain in the wastewater and could be transported till the filters where they clog clear spacing and provoke blockages. Measuring the settle able solids provides information about the efficiency of the digester as a settler and the removal of the solids in the ABR.
Methodology:
The quantity of settle able solids after any treatment step is measured in the laboratory applying an Imhoff cone. Every 30 minutes the quantity of the settle able solids is registered until there are no more visible changes (latest after 2 hours).
Alkalinity:
The alkalinity of a mixture of materials or a solution is the acid binding capacity, identified by measuring how many hydrogen ions a solution could buffer until it becomes acid. If the alkalinity is low, the buffering capacity is low, too, and this affects the pH more drastically. The level of alkalinity informs about the treatment stability of the Biogas/DEWATsystem.
Wastewater contains a great number of phosphate ions, organic material, and ammonium and sulphide ions; hence the alkalinity should be much higher in sewage than in tab water.
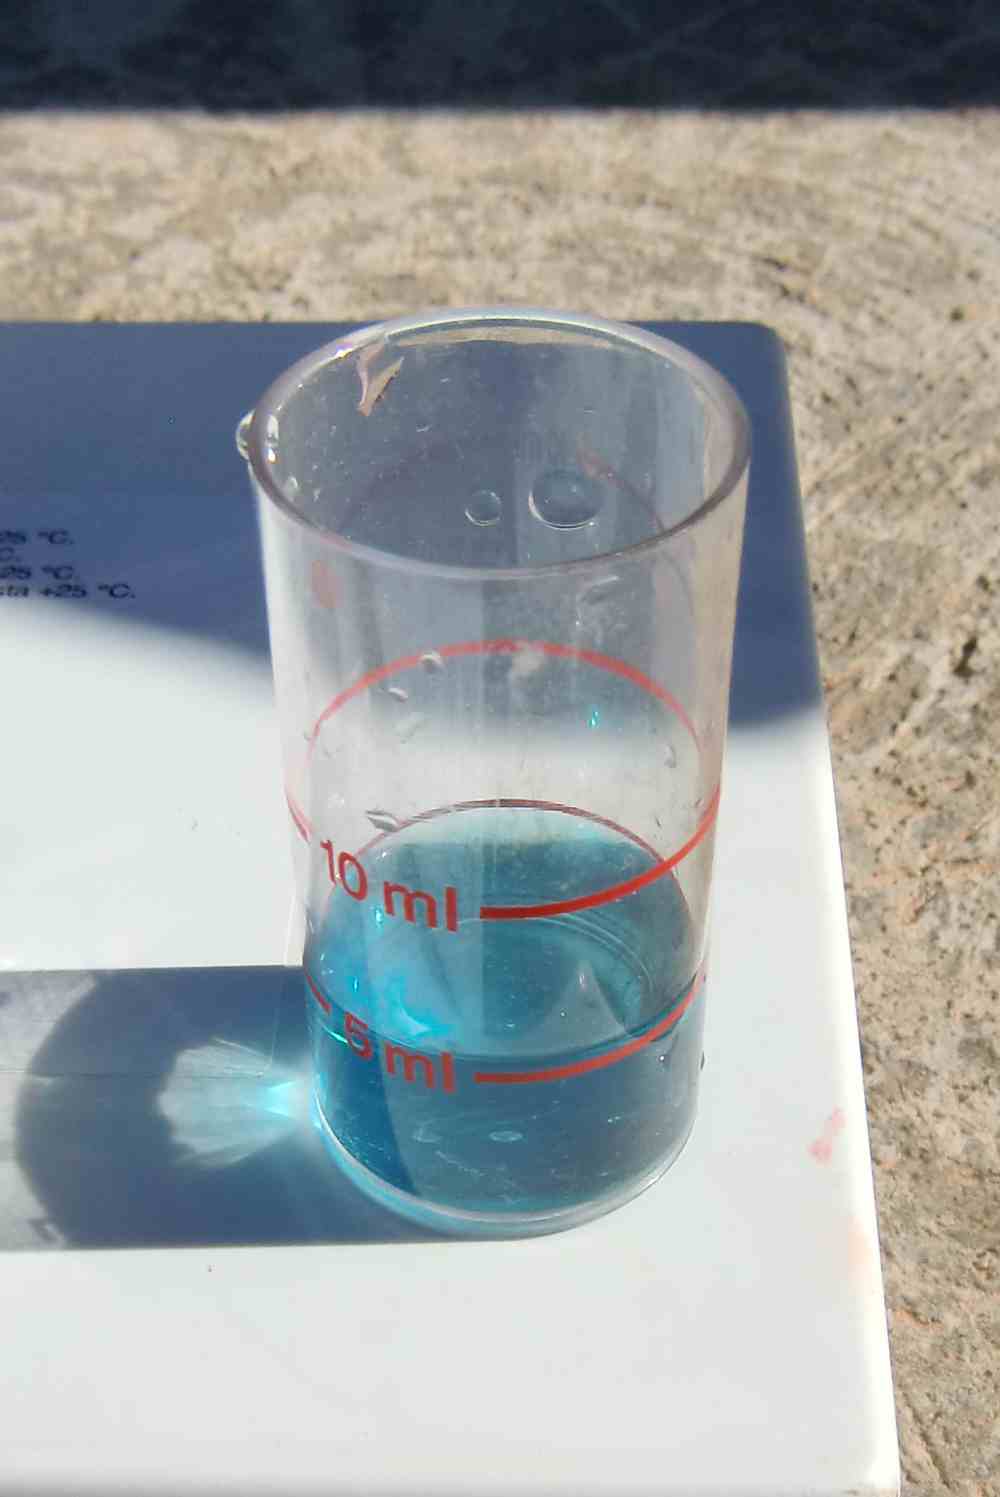
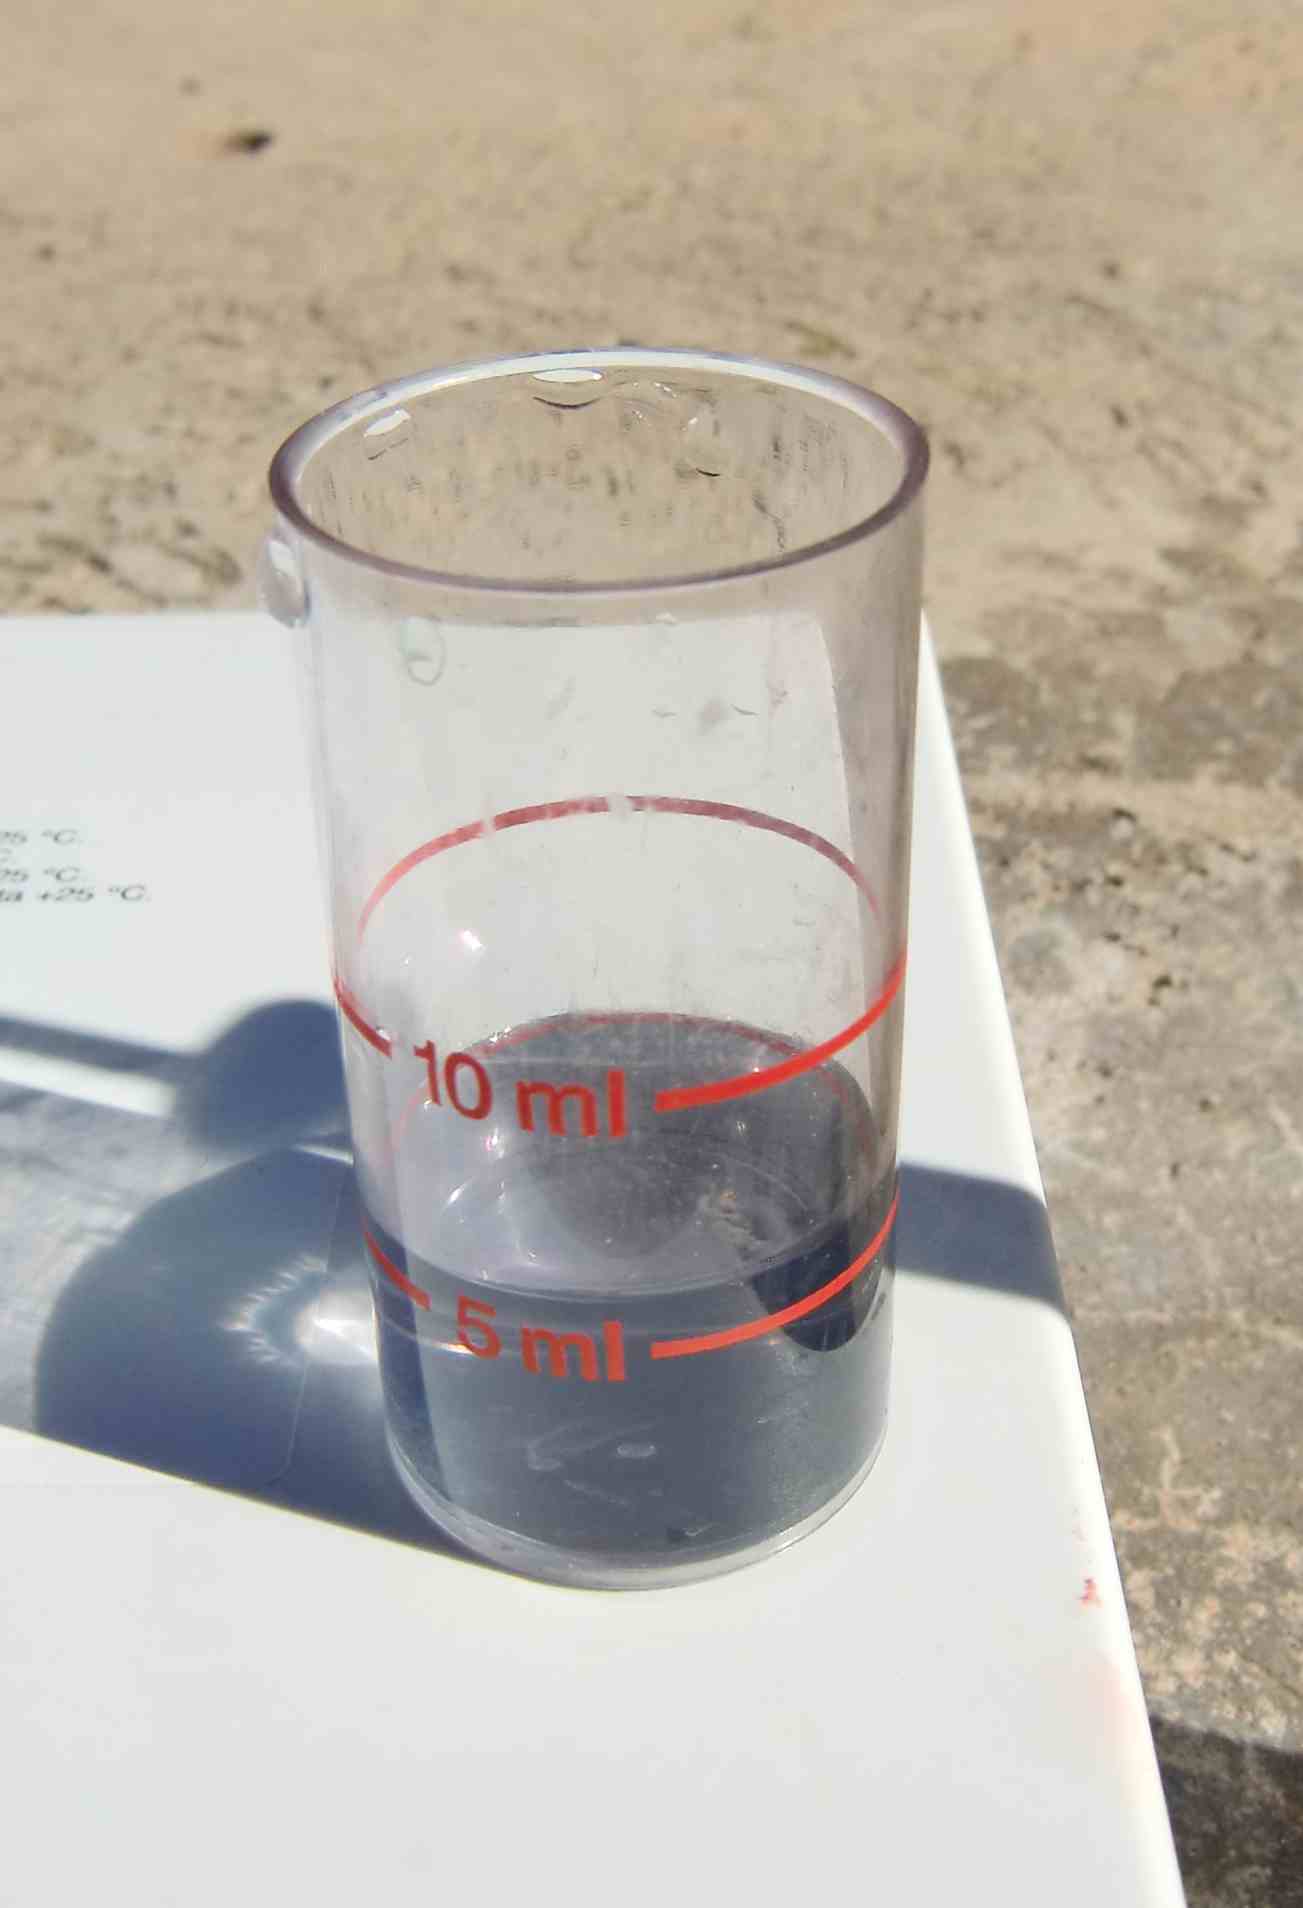
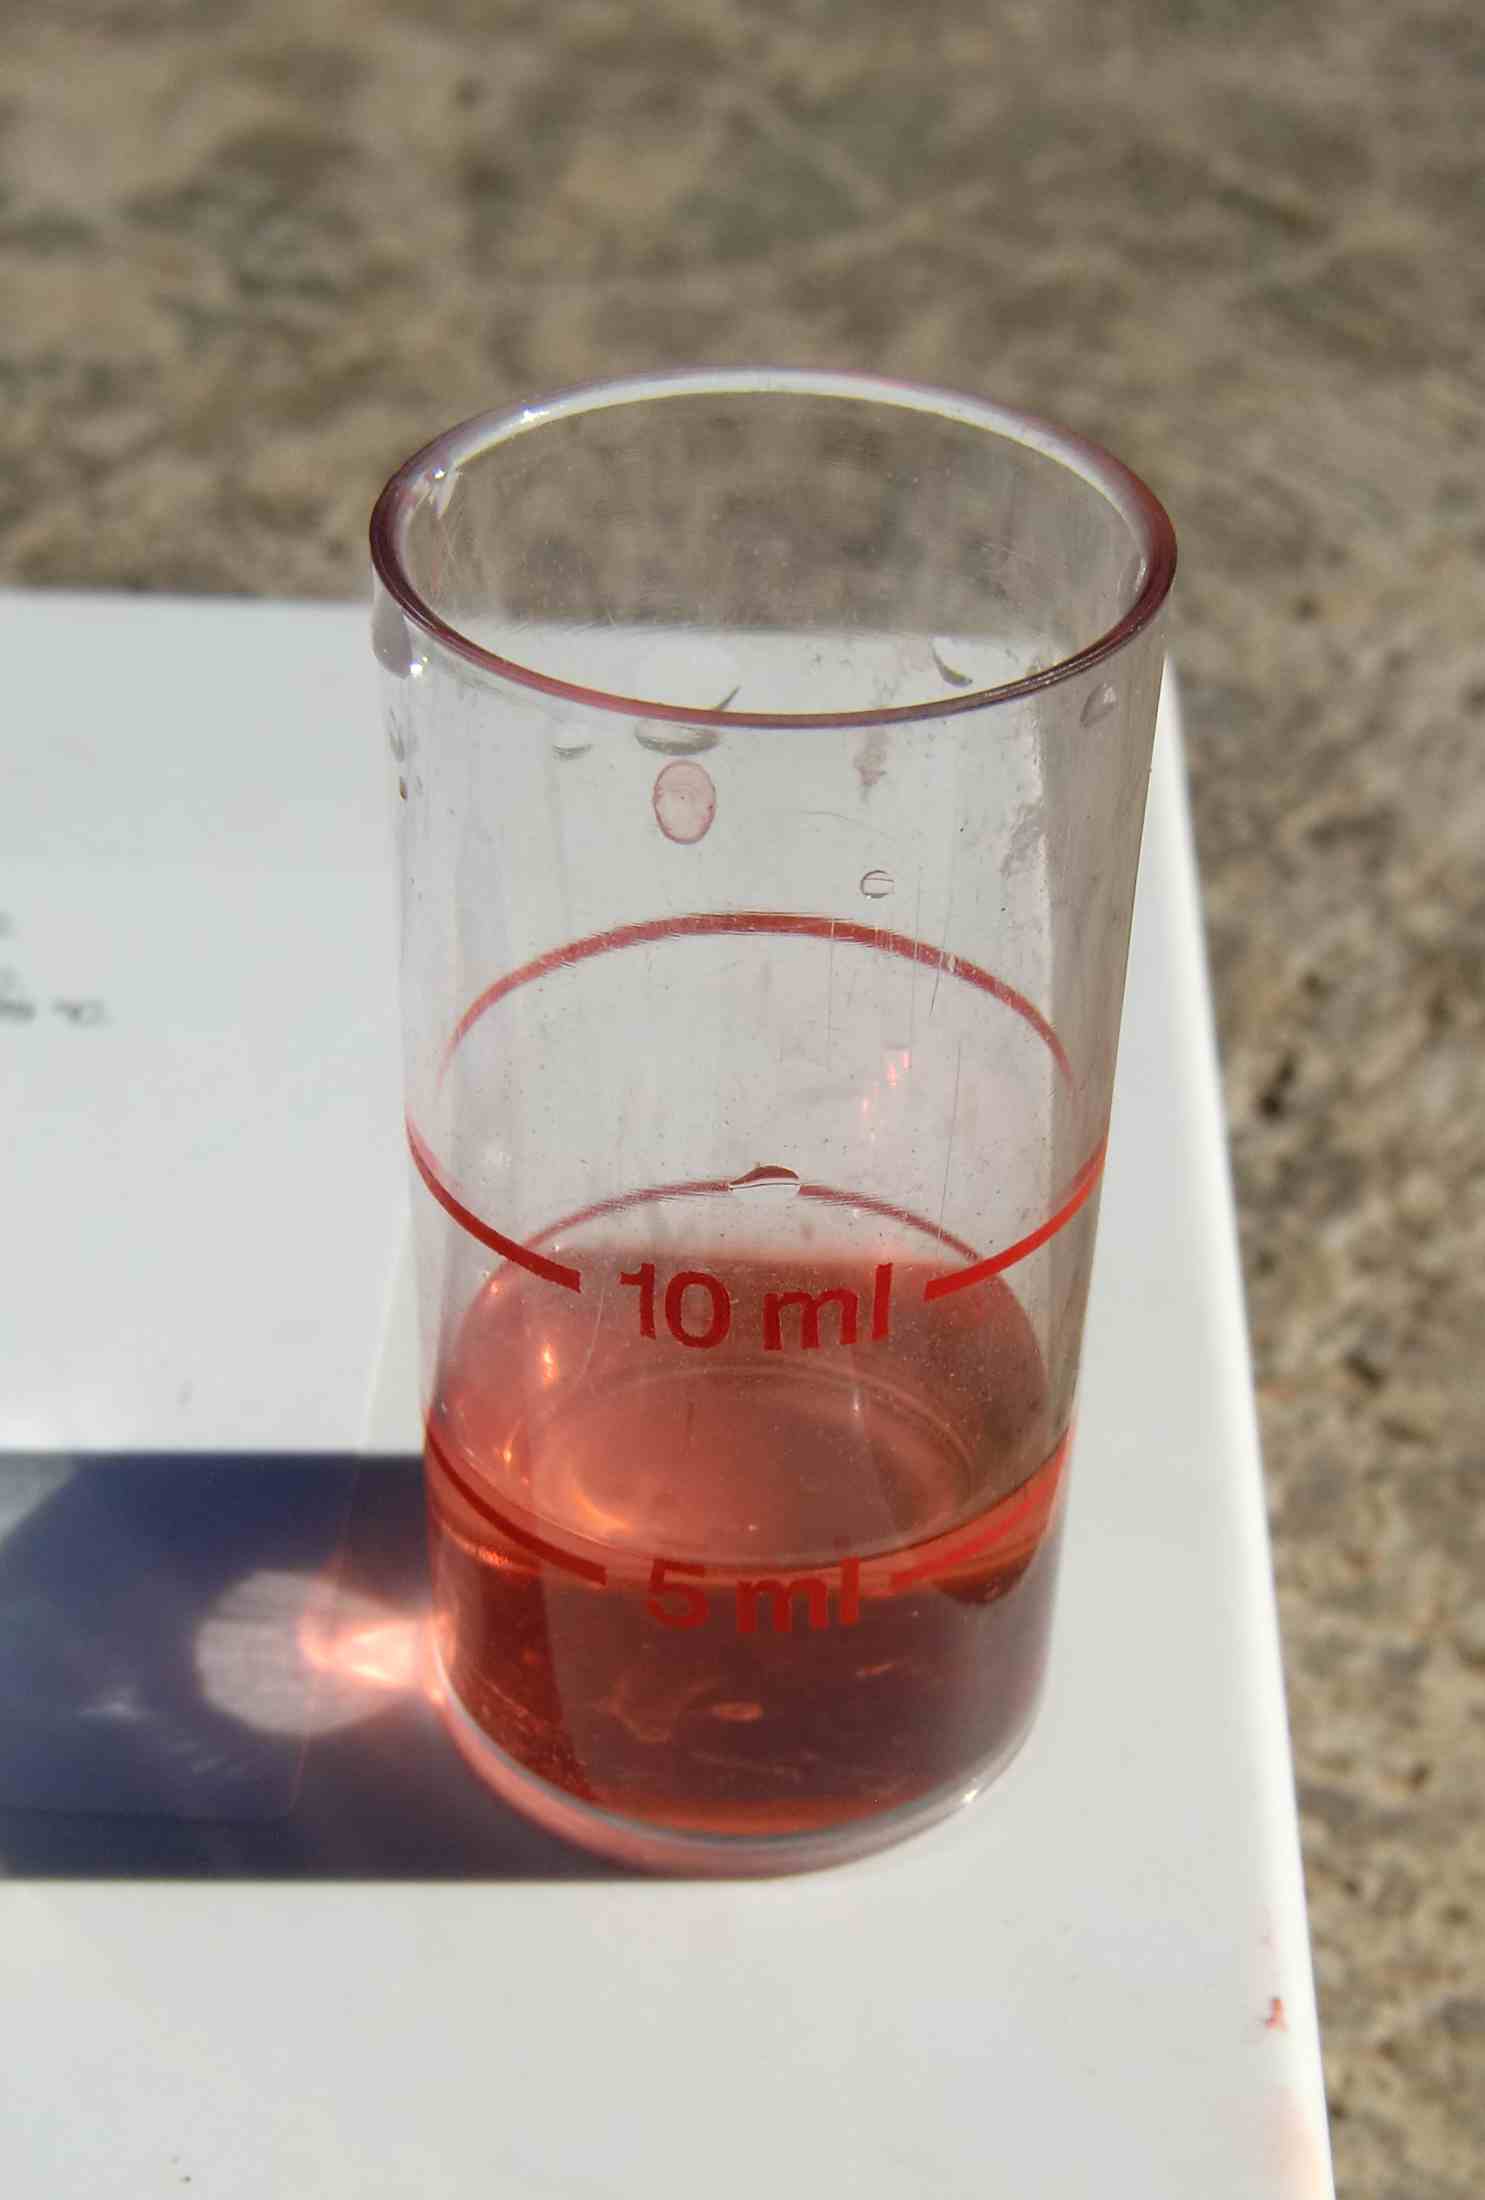 Figure 6: Alkalinity titration test: colour changes from blue to orange
4. Equipment
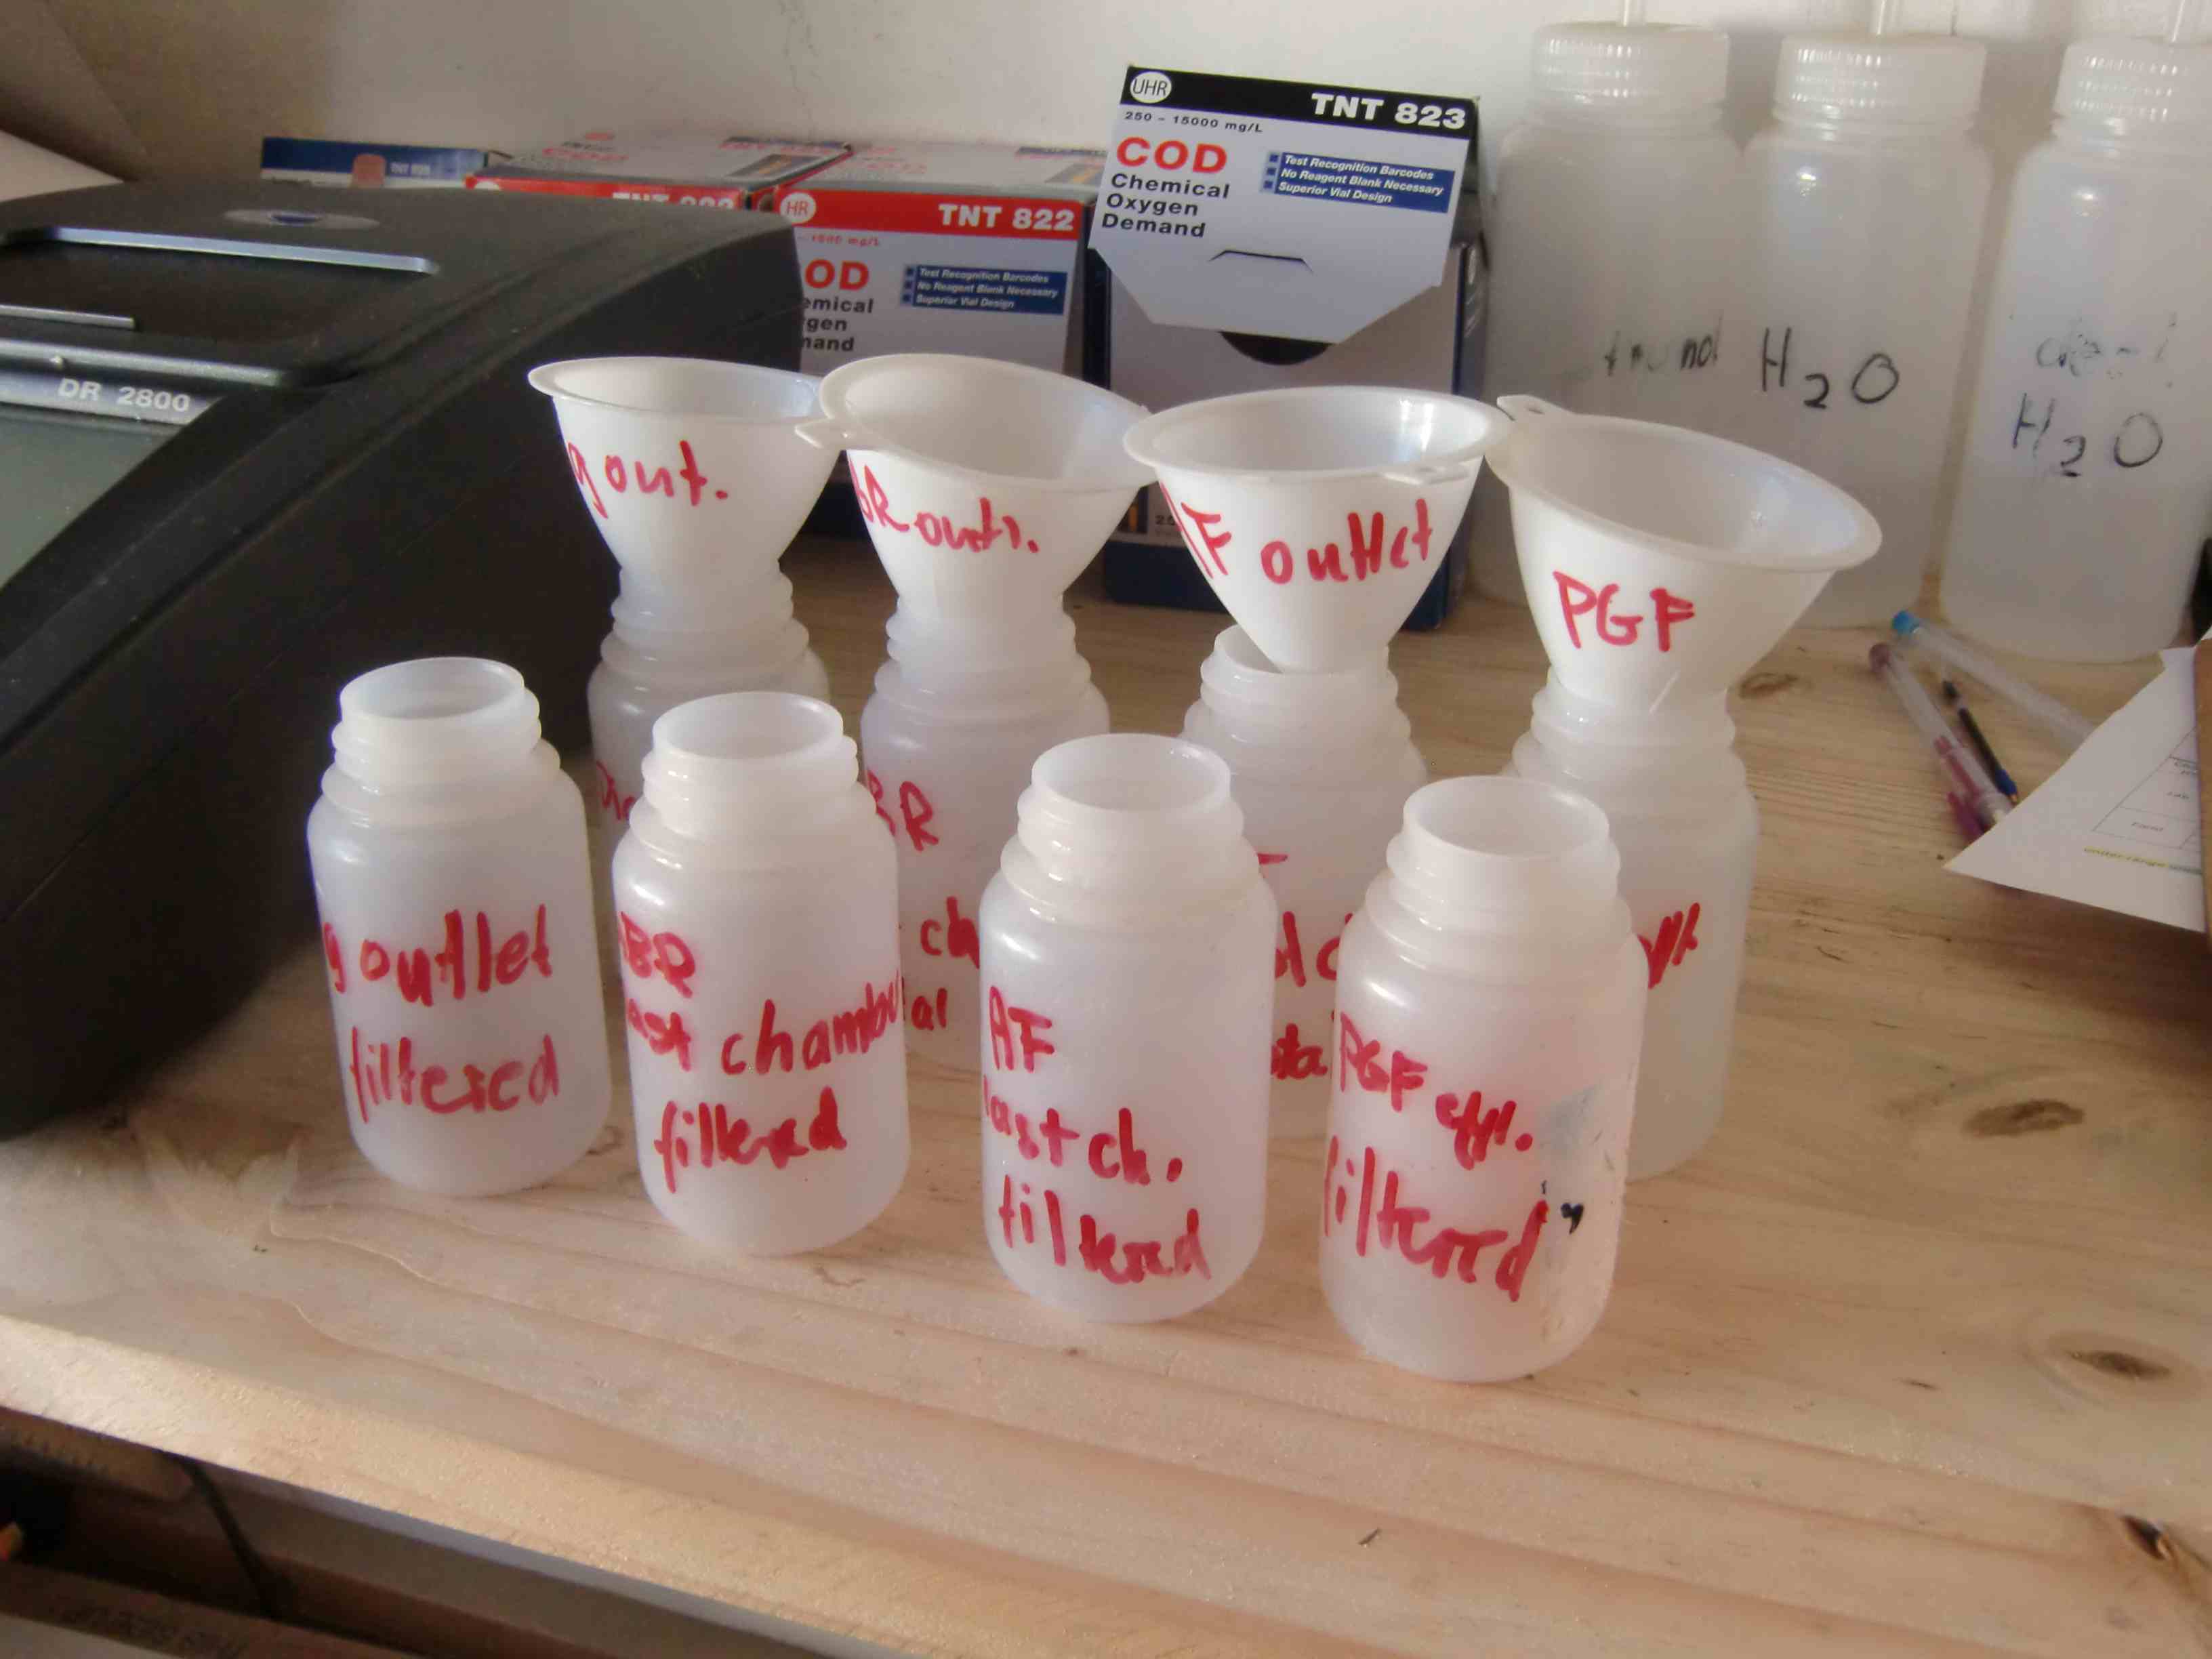
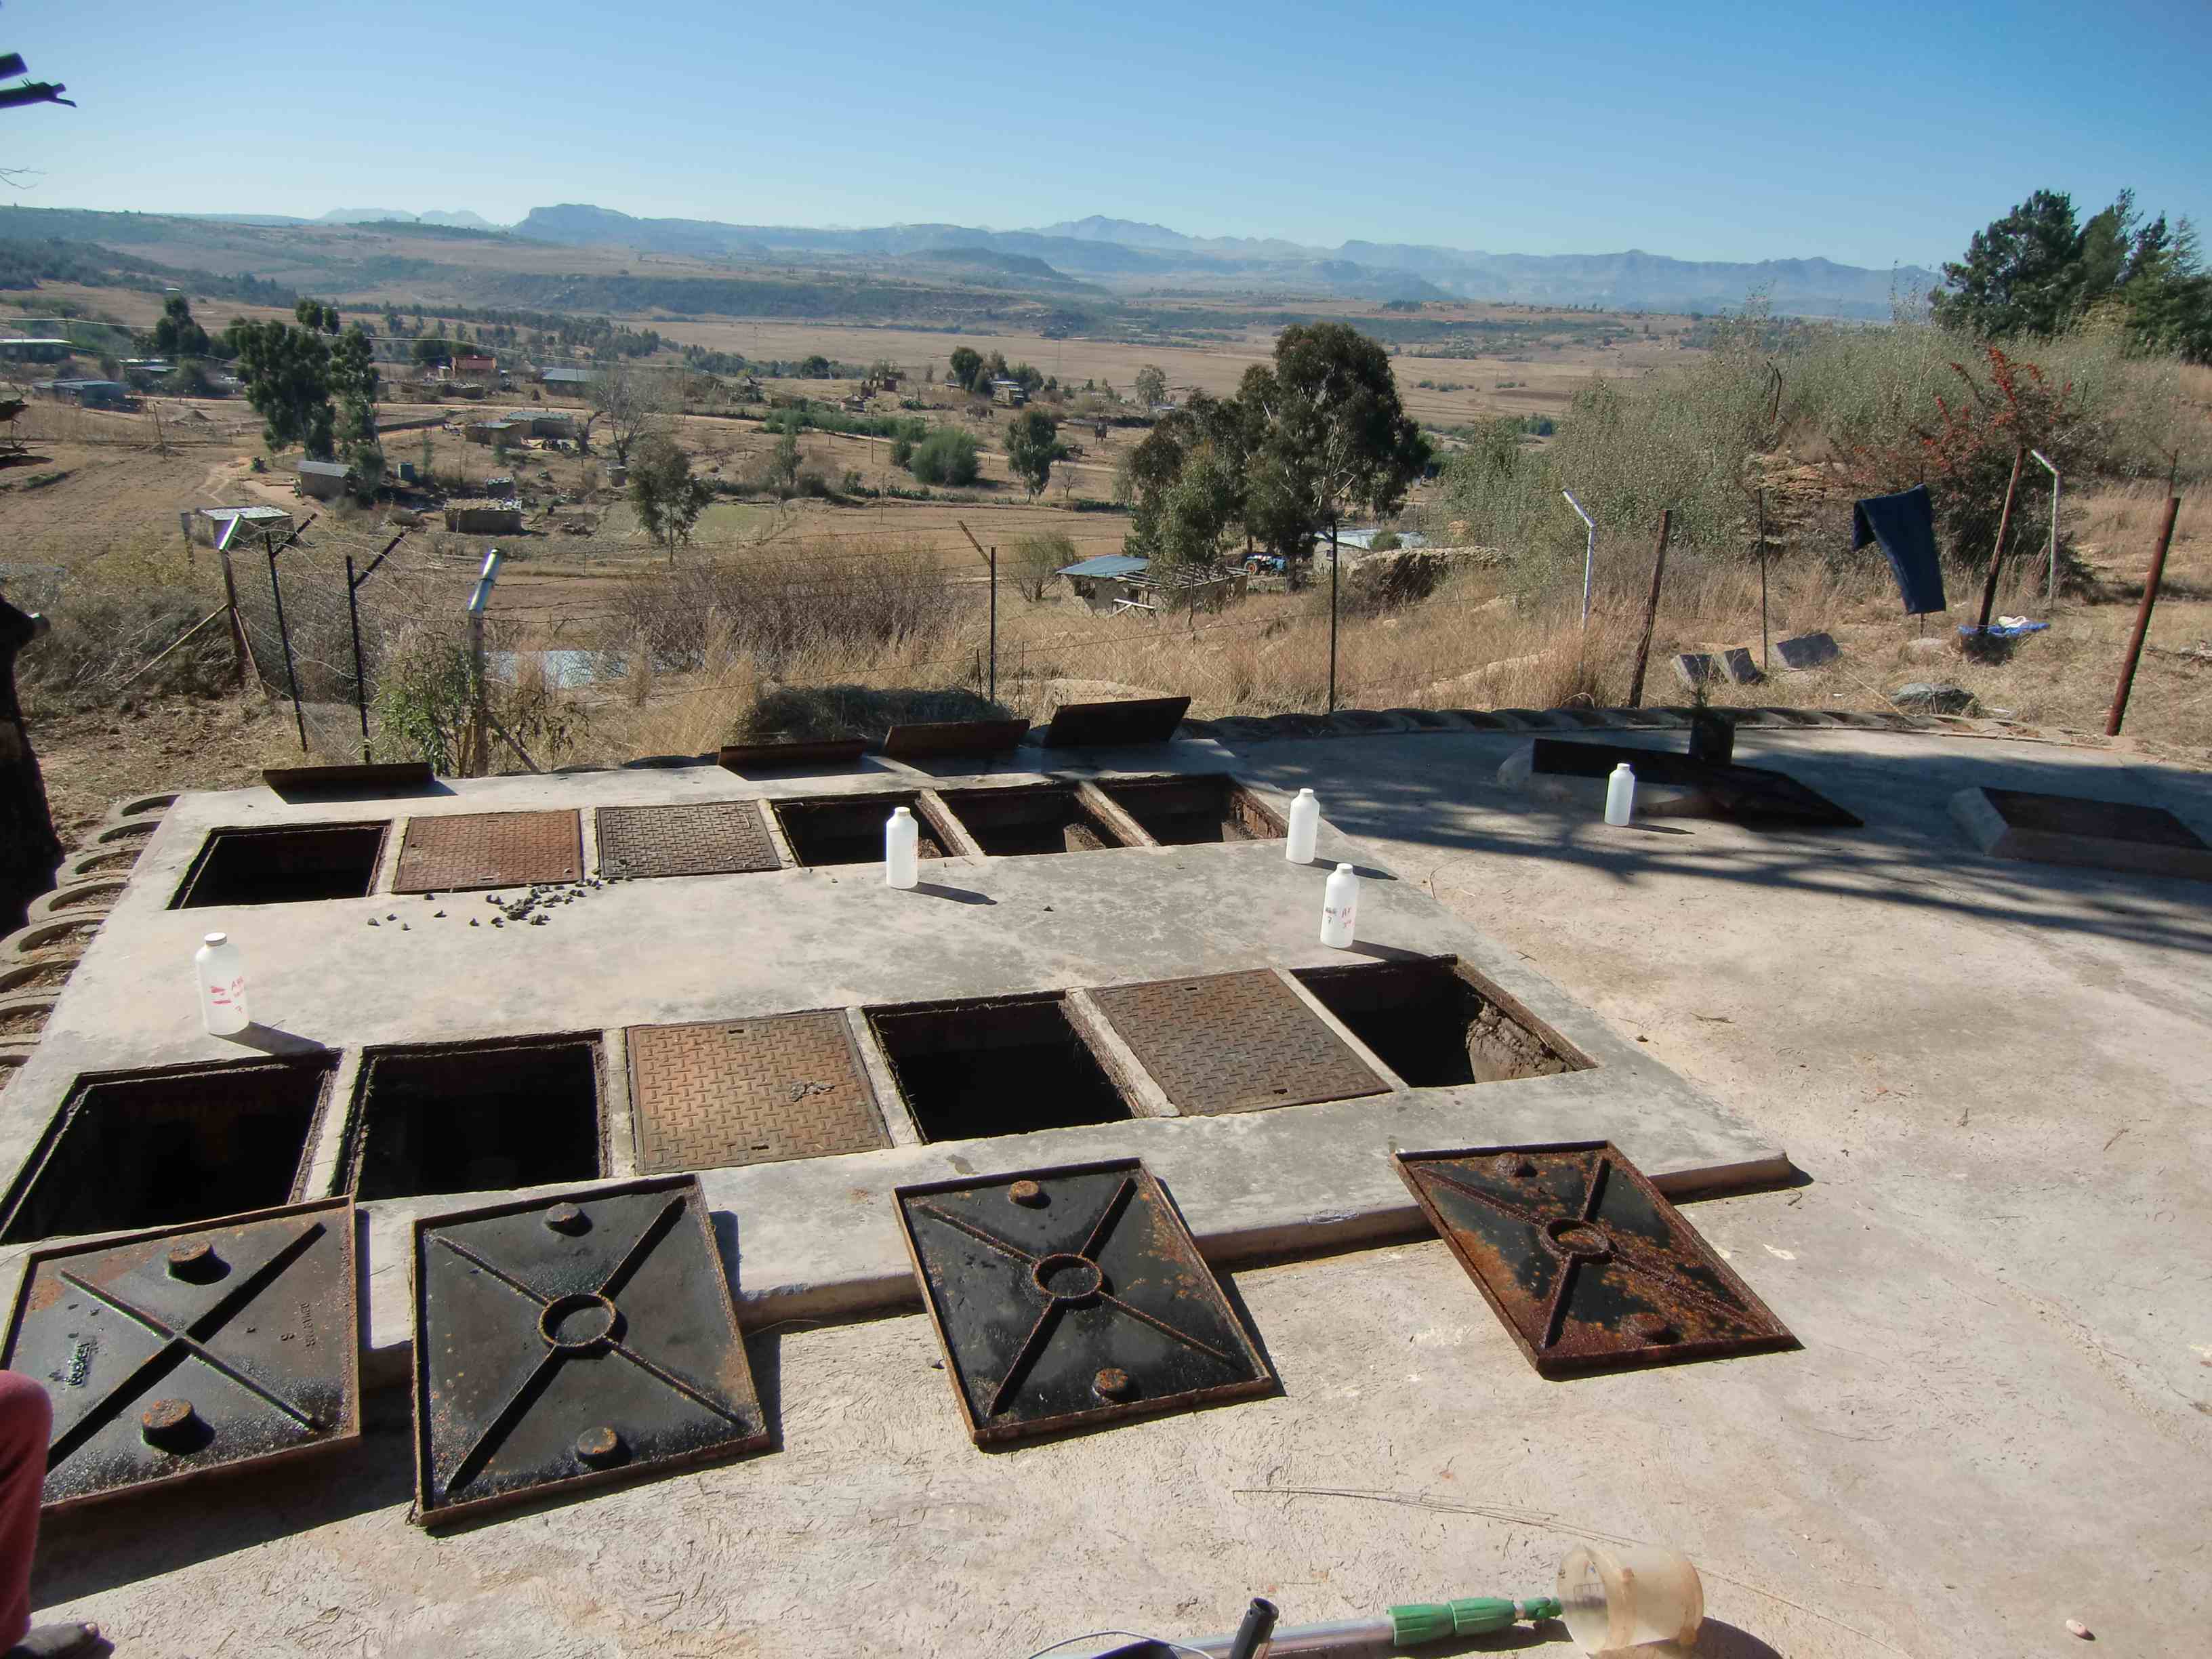 Figure 7: Filtration of wastewater samples; sample taking at the site; COD vials
Before starting to take samples the laboratory had to be prepared in order to be ready for incoming samples, especially as the COD must be measured within 4 hours after sampling; otherwise the result could be inaccurate, because the biodegradation has already started and changed the COD significantly. The following equipment was used in the laboratory:
- Digital Reactor Block from HACH to heat the COD vial exactly for 120 minutes at 150°C and cool it down afterwards for 20 minutes to 120°C
- Spectrophotometer from HACH to measure the COD
- COD vials for different ranges
- High ranges for the digester outlet (250-15000mg COD/l)
- Low ranges for sample points further away from the digester inlet (20-1500 mg COD/l)
- Pipettes with different accuracy
- ccurate for 0.01 ml measurements for the high range COD test (1ml pipette)
- ccurate for 0.1 ml measurements for the low range COD test (5ml pipette)
- Distilled water
- Ethanol
- Feed hopper
- Filter paper
- Imhoff cone to measure the settle able solids
- Small bottles for mixing, filtration and easy handling of the wastewater samples in the laboratory
- Watch to keep the time during the settling experiment
- Protocol template
- Prepared stick to take wastewater samples out of the manholes
- Thermometer
- Bottles of at least one litre and at least one for each sampling point where COD should be analysed
- A funnel Tool for opening manhole covers
- Alkalinity test kit Shovel to remove the swimming sludge
- A cooling box for transport of the samples to the laboratory
- Distilled water for cleaning sampling tools and to dilute samples for the alkalinity test pH test paper strips
- Waterproofed pen
- Protocol template and pen Calculator
5. Site information
 Figure 8: Biogas/DEWATS plant at Children’s Home
Biogas/DEWATS installations are tailor-made for specific site conditions considering the number of residents, toilet (waterborne or dry), bath, shower and laundry technologies that are feeding the system. The following table summarizes the dimensioning facts about the Biogas/DEWATS plant at Children’s Home.
| Input figures | Size of the system | ||
|---|---|---|---|
| Number of users | 45 | Biogas plant | 9 m3 |
| Amount of waste water | 3.2 m3 | ABR | 10 m3 |
| Biogas utilisation | yes | PGF | 30 m3 |
6. The day of measurements

Figure 9: ABR and PGF on the sampling day

Figure 10: pH sampling at the ABR
The measurement day, June 2nd 2011, was a sunny day with the highest temperature of 14.8°C and lowest temperature of -3.2°C. There has been no rain since several days. About two weeks ago, a water meter has been installed and the children staying in Children’s Home haven been asked to help with the water meter reading. To get reasonably correct information about the water consumption, the water meter reading was controlled at least every 3 days. Measurement on June 2nd 2011 started at the water tap where pH, temperature and alkalinity were taken, followed by the same measurements at the digester inlet and outlet, the 1st, 3rd and last chamber of the ABR, the last chamber of the anaerobic filter (AF) and the PGF effluent. Further samples to be later analysed in the laboratory were taken at the digester outlet, the 1st, the 3rd and the last chamber of the ABR, the last chamber of the AF and the PGF effluent. The children living at the place accompanied the measurement activities, and their interest was answered with explanations about the processes happening in the system. They helped during the measurements and took photos; maybe one day some of them will work in the field of sanitation and wastewater treatment. After the sample taking the samples were brought immediately to the laboratory in the TED office where the settle able solids and the COD were analysed.
7. Results
| Measuring Point | Alkalinity | COD total | COD (filtered) | Settle able solids | Temperature | pH | ||||||
| Number | Description | diluted 1:4 | undiluted | 30 min | 1 h | 1,5 h | 2 h | note | ||||
| mmol/l | mmol/l | mg/l | mg/l | ml | °C | |||||||
| 1 | Tab water | 2,85 | 2,85 | 11 | 6,7 | |||||||
| 2 | Digester inlet | 0,80 | 4,00 | 11 | 6,4 | |||||||
| 3 | Digester outlet | 2,15 | 10,75 | 443 | 321 | 2,00 | 2,00 | 2,00 | 2,00 | hairs bloged | 12 | 6,7 |
| 4 | ABR 1st chamber | 1,50 | 7,50 | 2,00 | 3,50 | 3,70 | 5,00 | 12,5 | 6,4 | |||
| 5 | ABR 2nd chamber | |||||||||||
| 6 | ABR 3rd chamber | 1,80 | 9,00 | 1,00 | 1,10 | 2,00 | 2,00 | 12,5 | 6,3 | |||
| 7 | ABR 4th chamber | |||||||||||
| 8 | ABR 5th chamber | |||||||||||
| 9 | ABR 6th chamber | |||||||||||
| 10 | ABR 7th chamber | 2,50 | 12,50 | 267 | 236 | 0,50 | 0,50 | 0,50 | 1,00 | 13 | 6,3 | |
| 11 | AF 1st chamber | |||||||||||
| 12 | AF 2nd chamber | |||||||||||
| 13 | AF 3rd chamber | 2,20 | 11,00 | 154 | 156 | 0,00 | 0,00 | 0,00 | 0,00 | 13 | 6,3 | |
| 14 | PGF effluent | 2,10 | 10,50 | 111 | 116 | 0,00 | 0,00 | 0,00 | 0,00 | 12 | 6,5 | |
The following diagram shows the wastewater production in Children’s Home during 2 weeks (18.05. - 04.06.2011) compared to wastewater data from 2010.

The wastewater production fluctuates significantly during the measurement period. As the water meter was installed at the overflow point of the PGF, rainwater collected in the PGF potentially changes the measured quantity. However, neither rain nor changes in the residents’ numbers explain these fluctuations. There was rainfall on May 24th and 25th, 2011 but at these days the water flow rate was low. Two additional residents have also no visible impact on the water consumption. The average of the water used every day is 1.23m3. In August 2010 an average water consumption of 0.14 m3 /day was measured. In this period, 20 to 26 persons lived in Children’s Home resulting in less water used by more people. Considering that in Germany one person uses 130 l water per day, it seems to be not realistic that 26 people in Lesotho use all together almost the same quantity. A failure in the measurements – or data recording or interpretation - of 2010 should be assumed.
If 15 residents use 1.23m3 water per day, one person uses about 80l of water per day. This quantity is more realistic.
Based on the daily flow rate and the plant size the retention time of the wastewater in the system can be estimated. The biogas digester in Children‘s Home has a volume of 9 m3; the retention time of the wastewater in the digester is up to 7 days. Organic matter dissolved in the wastewater will be flushed through the digester in this short time while settle able solids will sink to the bottom and stay there for a longer time period if the velocity of the water is not too fast. In each chamber of the ABR the water has a retention time of about 18 hours and the load in the PGF is 0.041m3 per m2 and day. As the system was built for 45 users and 3.2m3 of wastewater per day, this Biogas/DEWATS is not used to its full potential.
Settle able solids:
The diagram of the settle able solids shows clearly that the amount of settle able solids reduces with every treatment step. In the last chamber of the Anaerobic Filter and in the PGF effluent no more settle able solids were found in the treated water. Blockages in the filter because of particles in the treated wastewater can therefore be excluded.

COD:
The following diagram shows the COD removal by the system. In the laboratory the COD of the total and the filtered water sample have been measured. Both the total COD and the COD of the filtered water sample go down continuously with every treatment step.
The first sample was taken at the digester outlet (sample point 3), where the organic load is high and settle able solids exist. There the total COD is 443 mg/l which, compared to the data of the 1st of September 2010 (1670 mg/l), is a low load. In September 2010 more residents lived in Children’s Home and they apparently used less water. Accordingly the organic load in the wastewater is higher. At sample point 10, chamber 7 of the ABR, the water still contains settle able solids but the difference between total COD and filtered COD decreased from 122 mg/l to 31 mg/l. 91 mg/l of the filter able solids have been removed in the ABR. At the last chamber of the Anaerobic Filter (sample point 13) the filtered and total COD are the same. Filterable solids have been removed totally up to this point so that the PGF isn’t loaded with particles which are able to block the filter material.

COD analysis on the 1st of September 2010 has resulted in much higher values; the water sample taken in 2010 at the effluent of the PGF showed even a higher COD than the COD measured in 2011 at the digester outlet. The PGF effluent quality measured in 2011 is in the range of the wastewater standards established by the German Government, which limits the COD for percolated water under 200 mg/l. The effluent COD measured at the Biogas/DEWATS at Children’s Home on June 2nd 2011 is 111 mg/l. In 2010 COD reduction took mainly place in the PGF; in 2011, the reduction occurs more continuously throughout the system.

The system temperature in 2011 is about 3°C lower than in 2011. For methane bacteria this difference could be already important for their operation. Higher temperatures allow more efficient COD removal and a higher percentage of methane in the biogas. But as the data is few and the operation of the system is influenced by many other conditions which can’t be observed properly a conclusion about the performance of the system at different temperatures can’t be done.
pH and alkalinity:
The pH value ranges below an acceptable pH value for methane bacteria and could thus affect the biogas production. However, during the measurements with the pH paper it has been observed that the colour of the dipped paper changes immediately into a darker shade after contact with air. Therefore it might be that data reading was misled.
Alkalinity is higher in the sewage then in the tab water. Sewage contains a lot of phosphate ions, organic matter, and ammonium and sulphide ions; they altogether increase the alkalinity. During the treatment process, and especially in the PGF, the alkalinity should go down, as phosphate should be reduced. Measurement data taken on June 2nd 2011 don’t reflect this effect. An explanation could be found in the fact that the plants in the PGF are ‘dead’ in winter and that the PGF works more efficiently in summer.
8. Conclusions
- Doubts about the representativeness of the data from these 2 measurement activities – 1 day in 2010, 1 day in 2011 - are accepted. There have to be more measurements not only on days with different weather conditions and ambient temperature ranges, but also in times with varying numbers of residents.
- The pH value should be measured with another method. The paper strips are too inexact.
- All in all the findings provide basic information about how the system works; but data on the overall performance of this Biogas/DEWATS with different system temperatures still needs to be collected.